| A | B | C | D | E | F | G | H | I | J | K | L | ||
|---|---|---|---|---|---|---|---|---|---|---|---|---|---|
| 1 |
|
||||||||||||
| 2 | |||||||||||||
| 3 | |||||||||||||
| 4 | |||||||||||||
| 5 | |||||||||||||
| 6 | |||||||||||||
| 7 | |||||||||||||
| 8 | |||||||||||||
| 9 | |||||||||||||
| 10 | |||||||||||||
| 11 | |||||||||||||
| 12 | |||||||||||||
| 13 | |||||||||||||
| 14 | |||||||||||||
| 15 | |||||||||||||
| 16 | |||||||||||||
| 17 | |||||||||||||
| 18 | |||||||||||||
| 19 | |||||||||||||
| 20 | |||||||||||||
| 21 | |||||||||||||
| 22 | |||||||||||||
| 23 | |||||||||||||
| 24 | |||||||||||||
| 25 | |||||||||||||
| 26 | |||||||||||||
| 27 | |||||||||||||
| 28 | |||||||||||||
| 29 | |||||||||||||
| 30 | |||||||||||||
| 31 | |||||||||||||
| 32 | |||||||||||||
| A | B | C | D | E | F | G | H | ||
|---|---|---|---|---|---|---|---|---|---|
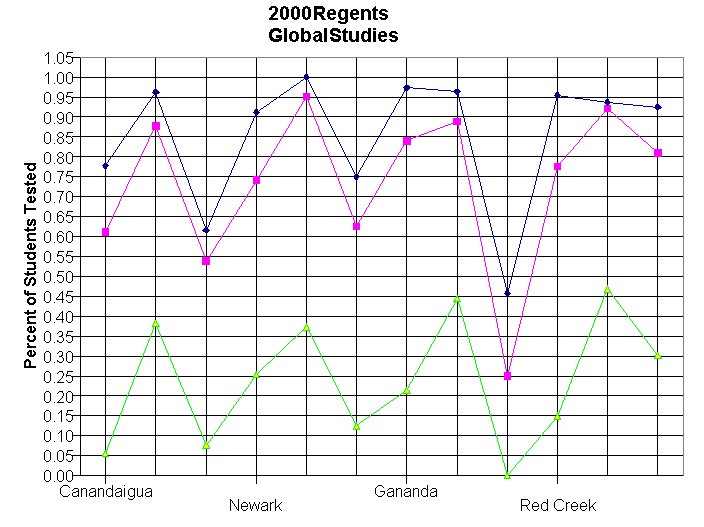
| 1 | District | %Tested 55-100 | %Tested 65-100 | %Tested 85-100 | Tested | 55-100 | 65-100 | 85-100 | |
| 2 | Canandaigua | 0.78 | 0.61 | 0.06 | 18 | 14 | 11 | 1 | |
| 3 | Gorham-Middlesex | 0.96 | 0.88 | 0.38 | 131 | 126 | 115 | 50 | |
| 4 | Phelps-Clifton Springs | 0.62 | 0.54 | 0.08 | 13 | 8 | 7 | 1 | |
| 5 | Newark | 0.91 | 0.74 | 0.25 | 205 | 187 | 152 | 52 | |
| 6 | Lyons | 1.00 | 0.95 | 0.37 | 83 | 83 | 79 | 31 | |
| 7 | Palmyra-Macedon | 0.75 | 0.63 | 0.13 | 8 | 6 | 5 | 1 | |
| 8 | Gananda | 0.97 | 0.84 | 0.21 | 75 | 73 | 63 | 16 | |
| 9 | Williamson | 0.96 | 0.89 | 0.44 | 108 | 104 | 96 | 48 | |
| 10 | North Rose-Wolcott | 0.46 | 0.25 | 0.00 | 24 | 11 | 6 | 0 | |
| 11 | Red Creek | 0.96 | 0.78 | 0.15 | 67 | 64 | 52 | 10 | |
| 12 | Dundee | 0.94 | 0.92 | 0.47 | 64 | 60 | 59 | 30 | |
| 13 | WFL BOCES | 0.92 | 0.81 | 0.30 | 796 | 736 | 645 | 240 | |
| 14 | East Bloomfield | 0.00 | 0.00 | 0.00 | 1 | ||||
| 15 | Seneca Falls | 0.00 | 0.00 | 0.00 | 1 | ||||
| 16 | Manchester-Shortsville | 0.00 | 0.00 | 0.00 | 3 | ||||
| 17 | Wayne | 0.00 | 0.00 | 0.00 | 1 | ||||
| 18 | Sodus | 0.00 | 0.00 | 0.00 | 4 | ||||
| 19 | Penn Yan | 0.00 | 0.00 | 0.00 | 1 |