| A | B | C | D | E | F | G | H | I | J | K | L | ||
|---|---|---|---|---|---|---|---|---|---|---|---|---|---|
| 1 |

|
||||||||||||
| 2 | |||||||||||||
| 3 | |||||||||||||
| 4 | |||||||||||||
| 5 | |||||||||||||
| 6 | |||||||||||||
| 7 | |||||||||||||
| 8 | |||||||||||||
| 9 | |||||||||||||
| 10 | |||||||||||||
| 11 | |||||||||||||
| 12 | |||||||||||||
| 13 | |||||||||||||
| 14 | |||||||||||||
| 15 | |||||||||||||
| 16 | |||||||||||||
| 17 | |||||||||||||
| 18 | |||||||||||||
| 19 | |||||||||||||
| 20 | |||||||||||||
| 21 | |||||||||||||
| 22 | |||||||||||||
| 23 | |||||||||||||
| 24 | |||||||||||||
| 25 | |||||||||||||
| 26 | |||||||||||||
| 27 | |||||||||||||
| 28 | |||||||||||||
| 29 | |||||||||||||
| 30 | |||||||||||||
| 31 | |||||||||||||
| 32 | |||||||||||||
| A | B | C | D | E | F | G | H | I | J | K | L | ||
|---|---|---|---|---|---|---|---|---|---|---|---|---|---|
| 1 |
|
||||||||||||
| 2 | |||||||||||||
| 3 | |||||||||||||
| 4 | |||||||||||||
| 5 | |||||||||||||
| 6 | |||||||||||||
| 7 | |||||||||||||
| 8 | |||||||||||||
| 9 | |||||||||||||
| 10 | |||||||||||||
| 11 | |||||||||||||
| 12 | |||||||||||||
| 13 | |||||||||||||
| 14 | |||||||||||||
| 15 | |||||||||||||
| 16 | |||||||||||||
| 17 | |||||||||||||
| 18 | |||||||||||||
| 19 | |||||||||||||
| 20 | |||||||||||||
| 21 | |||||||||||||
| 22 | |||||||||||||
| 23 | |||||||||||||
| 24 | |||||||||||||
| 25 | |||||||||||||
| 26 | |||||||||||||
| 27 | |||||||||||||
| 28 | |||||||||||||
| 29 | |||||||||||||
| 30 | |||||||||||||
| 31 | |||||||||||||
| 32 | |||||||||||||
| A | B | C | D | E | F | G | H | ||
|---|---|---|---|---|---|---|---|---|---|
| 1 | DISTRICT_CD | District Name | %tested55-100 | %tested65-100 | %tested85-100 | YEAR | SUBJECT_CD | Tested | |
| 2 | 430300 | Canandaigua | 0.97 | 0.93 | 0.59 | 1998 | REG_SQM1 | 274 | |
| 3 | 430501 | East Bloomfield | 0.96 | 0.94 | 0.52 | 1998 | REG_SQM1 | 89 | |
| 4 | 430700 | Geneva | 0.94 | 0.85 | 0.47 | 1998 | REG_SQM1 | 168 | |
| 5 | 430901 | Gorham-Middlesex | 0.98 | 0.96 | 0.68 | 1998 | REG_SQM1 | 120 | |
| 6 | 431101 | Manchester-Shortsville | 0.67 | 0.53 | 0.23 | 1998 | REG_SQM1 | 94 | |
| 7 | 431201 | Naples | 0.95 | 0.90 | 0.42 | 1998 | REG_SQM1 | 83 | |
| 8 | 431301 | Phelps-Clifton Springs | 0.95 | 0.91 | 0.46 | 1998 | REG_SQM1 | 151 | |
| 9 | 431401 | Honeoye | 0.92 | 0.91 | 0.27 | 1998 | REG_SQM1 | 64 | |
| 10 | 431701 | Victor | 0.90 | 0.82 | 0.55 | 1998 | REG_SQM1 | 221 | |
| 11 | 650101 | Newark | 0.91 | 0.80 | 0.44 | 1998 | REG_SQM1 | 224 | |
| 12 | 650301 | Clyde-Savannah | 0.72 | 0.58 | 0.26 | 1998 | REG_SQM1 | 106 | |
| 13 | 650501 | Lyons | 0.85 | 0.78 | 0.30 | 1998 | REG_SQM1 | 73 | |
| 14 | 650701 | Marion | 0.85 | 0.77 | 0.37 | 1998 | REG_SQM1 | 94 | |
| 15 | 650801 | Wayne | 0.92 | 0.88 | 0.57 | 1998 | REG_SQM1 | 169 | |
| 16 | 650901 | Palmyra-Macedon | 0.76 | 0.64 | 0.28 | 1998 | REG_SQM1 | 207 | |
| 17 | 650902 | Gananda | 0.87 | 0.79 | 0.51 | 1998 | REG_SQM1 | 78 | |
| 18 | 651201 | Sodus | 0.83 | 0.72 | 0.28 | 1998 | REG_SQM1 | 90 | |
| 19 | 651402 | Williamson | 0.96 | 0.91 | 0.49 | 1998 | REG_SQM1 | 90 | |
| 20 | 651501 | North Rose -Wolcott | 0.80 | 0.70 | 0.28 | 1998 | REG_SQM1 | 133 |
| 21 | 651503 | Red Creek | 1.00 | 0.98 | 0.72 | 1998 | REG_SQM1 | 61 | |
|---|---|---|---|---|---|---|---|---|---|
| 22 | 680601 | Penn Yan | 0.81 | 0.75 | 0.40 | 1998 | REG_SQM1 | 178 | |
| 23 | 680801 | Dundee | 0.91 | 0.85 | 0.29 | 1998 | REG_SQM1 | 65 | |
| 24 | 560603 | Romulus | 0.98 | 0.85 | 0.32 | 1998 | REG_SQM1 | 47 | |
| 25 | 560701 | Seneca Falls | 0.87 | 0.82 | 0.43 | 1998 | REG_SQM1 | 91 | |
| 26 | 561006 | Waterloo | 0.87 | 0.81 | 0.44 | 1998 | REG_SQM1 | 116 | |
| 27 | WFL BOCES | 0.89 | 0.82 | 0.42 | 3086 | ||||
| 28 | |||||||||
| 29 | DISTRICT_CD | District Name | %tested55-100 | %tested65-100 | %tested85-100 | YEAR | SUBJECT_CD | Tested | |
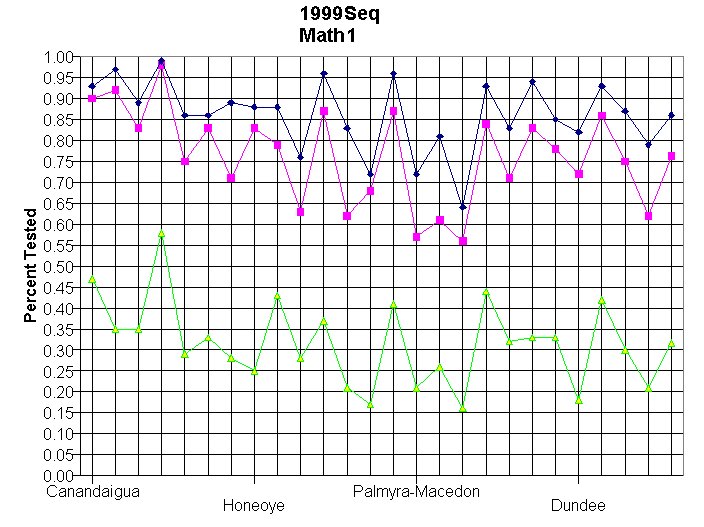
| 30 | 430300 | Canandaigua | 0.93 | 0.90 | 0.47 | 1999 | REG_SQM1 | 335 | |
| 31 | 430501 | East Bloomfield | 0.97 | 0.92 | 0.35 | 1999 | REG_SQM1 | 91 | |
| 32 | 430700 | Geneva | 0.89 | 0.83 | 0.35 | 1999 | REG_SQM1 | 219 | |
| 33 | 430901 | Gorham-Middlesex | 0.99 | 0.98 | 0.58 | 1999 | REG_SQM1 | 130 | |
| 34 | 431101 | Manchester-Shortsville | 0.86 | 0.75 | 0.29 | 1999 | REG_SQM1 | 84 | |
| 35 | 431201 | Naples | 0.86 | 0.83 | 0.33 | 1999 | REG_SQM1 | 94 | |
| 36 | 431301 | Phelps-Clifton Springs | 0.89 | 0.71 | 0.28 | 1999 | REG_SQM1 | 205 | |
| 37 | 431401 | Honeoye | 0.88 | 0.83 | 0.25 | 1999 | REG_SQM1 | 100 | |
| 38 | 431701 | Victor | 0.88 | 0.79 | 0.43 | 1999 | REG_SQM1 | 254 | |
| 39 | 650101 | Newark | 0.76 | 0.63 | 0.28 | 1999 | REG_SQM1 | 228 | |
| 40 | 650301 | Clyde-Savannah | 0.96 | 0.87 | 0.37 | 1999 | REG_SQM1 | 95 |
| 41 | 650501 | Lyons | 0.83 | 0.62 | 0.21 | 1999 | REG_SQM1 | 81 | |
|---|---|---|---|---|---|---|---|---|---|
| 42 | 650701 | Marion | 0.72 | 0.68 | 0.17 | 1999 | REG_SQM1 | 82 | |
| 43 | 650801 | Wayne | 0.96 | 0.87 | 0.41 | 1999 | REG_SQM1 | 180 | |
| 44 | 650901 | Palmyra-Macedon | 0.72 | 0.57 | 0.21 | 1999 | REG_SQM1 | 247 | |
| 45 | 650902 | Gananda | 0.81 | 0.61 | 0.26 | 1999 | REG_SQM1 | 72 | |
| 46 | 651201 | Sodus | 0.64 | 0.56 | 0.16 | 1999 | REG_SQM1 | 109 | |
| 47 | 651402 | Williamson | 0.93 | 0.84 | 0.44 | 1999 | REG_SQM1 | 116 | |
| 48 | 651501 | North Rose -Wolcott | 0.83 | 0.71 | 0.32 | 1999 | REG_SQM1 | 145 | |
| 49 | 651503 | Red Creek | 0.94 | 0.83 | 0.33 | 1999 | REG_SQM1 | 81 | |
| 50 | 680601 | Penn Yan | 0.85 | 0.78 | 0.33 | 1999 | REG_SQM1 | 211 | |
| 51 | 680801 | Dundee | 0.82 | 0.72 | 0.18 | 1999 | REG_SQM1 | 68 | |
| 52 | 560603 | Romulus | 0.93 | 0.86 | 0.42 | 1999 | REG_SQM1 | 43 | |
| 53 | 560701 | Seneca Falls | 0.87 | 0.75 | 0.30 | 1999 | REG_SQM1 | 126 | |
| 54 | 561006 | Waterloo | 0.79 | 0.62 | 0.21 | 1999 | REG_SQM1 | 146 | |
| 55 | WFL BOCES | 0.86 | 0.76 | 0.32 | 3542 | ||||
| 56 | |||||||||
| 57 | DISTRICT_CD | District Name | %tested55-100 | %tested65-100 | %tested85-100 | YEAR | SUBJECT_CD | Tested | |
| 58 | 430300 | Canandaigua | 0.84 | 0.72 | 0.11 | 2000 | REG_SQM1 | 88 | |
| 59 | 430501 | East Bloomfield | 0.93 | 0.88 | 0.52 | 2000 | REG_SQM1 | 107 | |
| 60 | 430700 | Geneva | 0.92 | 0.84 | 0.41 | 2000 | REG_SQM1 | 212 |
| 61 | 430901 | Gorham-Middlesex | 0.99 | 0.98 | 0.78 | 2000 | REG_SQM1 | 129 | |
|---|---|---|---|---|---|---|---|---|---|
| 62 | 431101 | Manchester-Shortsville | 0.71 | 0.63 | 0.33 | 2000 | REG_SQM1 | 82 | |
| 63 | 431301 | Phelps-Clifton Springs | 0.83 | 0.71 | 0.36 | 2000 | REG_SQM1 | 214 | |
| 64 | 431401 | Honeoye | 0.72 | 0.65 | 0.23 | 2000 | REG_SQM1 | 95 | |
| 65 | 431701 | Victor | 0.93 | 0.88 | 0.54 | 2000 | REG_SQM1 | 223 | |
| 66 | 650101 | Newark | 0.75 | 0.61 | 0.27 | 2000 | REG_SQM1 | 228 | |
| 67 | 650301 | Clyde-Savannah | 0.72 | 0.56 | 0.24 | 2000 | REG_SQM1 | 50 | |
| 68 | 650501 | Lyons | 0.87 | 0.75 | 0.41 | 2000 | REG_SQM1 | 95 | |
| 69 | 650701 | Marion | 0.68 | 0.61 | 0.15 | 2000 | REG_SQM1 | 74 | |
| 70 | 650801 | Wayne | 0.76 | 0.66 | 0.38 | 2000 | REG_SQM1 | 203 | |
| 71 | 650901 | Palmyra-Macedon | 0.90 | 0.68 | 0.21 | 2000 | REG_SQM1 | 62 | |
| 72 | 650902 | Gananda | 0.92 | 0.73 | 0.35 | 2000 | REG_SQM1 | 26 | |
| 73 | 651201 | Sodus | 0.81 | 0.70 | 0.18 | 2000 | REG_SQM1 | 113 | |
| 74 | 651402 | Williamson | 0.69 | 0.58 | 0.32 | 2000 | REG_SQM1 | 126 | |
| 75 | 651501 | North Rose -Wolcott | 0.78 | 0.66 | 0.29 | 2000 | REG_SQM1 | 179 | |
| 76 | 651503 | Red Creek | 0.95 | 0.89 | 0.62 | 2000 | REG_SQM1 | 76 | |
| 77 | 680601 | Penn Yan | 0.87 | 0.79 | 0.40 | 2000 | REG_SQM1 | 200 | |
| 78 | 680801 | Dundee | 0.82 | 0.69 | 0.27 | 2000 | REG_SQM1 | 88 | |
| 79 | 560603 | Romulus | 0.92 | 0.84 | 0.46 | 2000 | REG_SQM1 | 50 | |
| 80 | 560701 | Seneca Falls | 0.89 | 0.80 | 0.40 | 2000 | REG_SQM1 | 117 | |
| 81 | 561006 | Waterloo | 0.89 | 0.76 | 0.27 | 2000 | REG_SQM1 | 164 | |
| 82 | WFL BOCES | 0.84 | 0.73 | 0.35 | 3001 |