For these exercises, you’ll access results for 4 different sets of State Assessment results. They are:
1.
ELA 4 Scores
2.
ELA 8 Scores
3.
Math 4 Scores
4.
Math 8 Scores
For each of the exams, you’ll display the following:
1.
Average Percentage breakdown by Level (1 through 4) for all years for your school
2.
Comparison of Percentage breakdowns by Level for each individual year for your school
3.
Comparison of percentage breakdowns by Level for Regular Education and Special Education
- Counts of Regular Education and Special Education students at each Level
4.
Regional comparison of percentage breakdowns by Level
5.
Average SPI (Standard Performance Indicator) for your school for each of the Standards (ELA) or Key Ideas (Math)
For demonstration purposes, we’ll use Batavia City Schools in our examples.

1.
Open Internet Explorer (or Netscape Communicator)
2.
In the Address bar type the following (figure 1):
Cognos.edutech.org
Cognos.edutech.org
Note: You don’t need to include “WWW” as part of the address
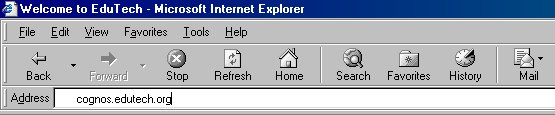
Figure 1
3.
Press the Enter key
4.
You will go to the main Cognos PowerPlay page (figure 2)
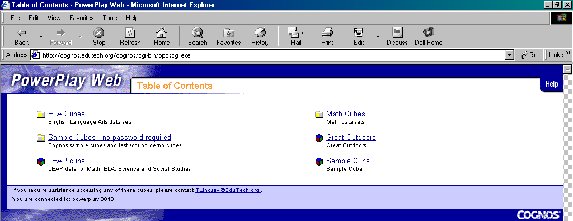
Back to top
Figure 2

In this example, we’ll log into the ELA 4 Scores cube
1.
From the main Cognos PowerPlay page, click the ELA Cubes link
2.
Click the ELA 4 Scores link. You’ll be asked to Log In (figure 3).
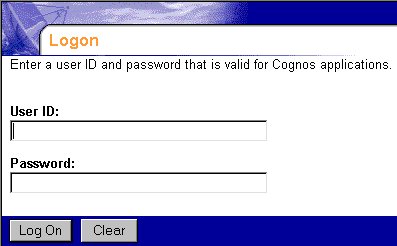
Figure 3
3.
When prompted for a User ID and Password, enter your user account name and your password
4.
Click the Log On button
5.
If you receive the message “Your user ID or password is incorrect. Please try again.” You’ve entered incorrect information. Reenter your user ID and password.
6.
After you’ve logged in successfully, you’ll see the ELA 4 Scores Cube
Back to top
 To get the ELA 4 results needed for the presentation, access the ELA 4 Scores data. After logging in, you will see the following page:
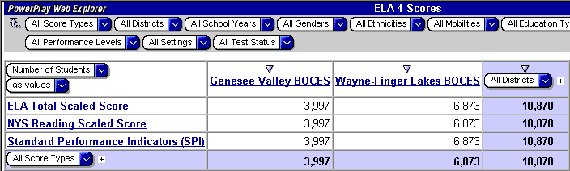
Figure 4
Exercise # 1: Average Percentage breakdown by Level (1 through 4) for all years for your school
1.
From the initial view (figure 4), click the BOCES to which your school belongs. Data for all of the schools within that BOCES are displayed (figure 5). Remember, we’re using Batavia City Schools which is in the Genesee Valley BOCES and in Genesee County.
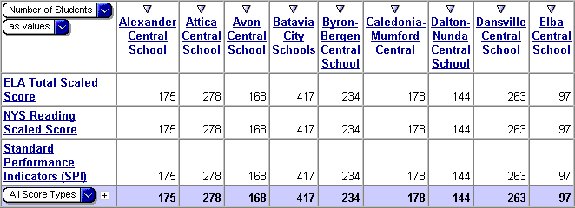
Figure 5
2. Place the mouse pointer over any of the school names without clicking. A “Fly-out” menu will appear. Place the mouse pointer over the word Action. Your screen should now look like figure 6.
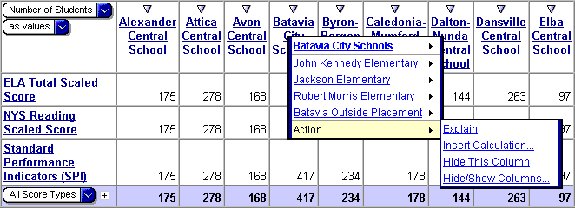
Figure 6
3.
Choose Hide/Show Columns from the fly-out menu. You’ll see a form similar to figure 7.

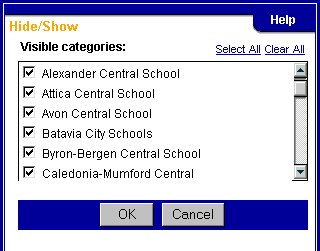
Figure 7
Figure 7
4.
Click Clear All. The check box to the left of every school name will be cleared.
5.
Click the check box to the left of your school name. You may need to scroll down to your school.
6.
Click the OK button. Your results will look similar to figure 8.
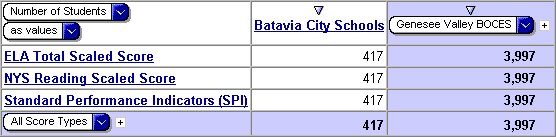
Figure 8
7.
Click the ELA Total Scaled Score link. Your results should look like figure 9.
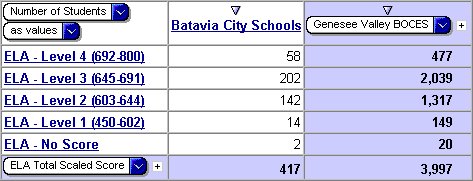
Figure 9
8.
Select as % of column total from the Measure Type Pulldown. Your results should look like figure 10.
ELA 4 Average Percentage Breakdown by Level

Figure 10
Exercise # 2: Comparison of Percentage breakdowns by Level for each individual year for your school
Your starting point for this exercise is the Exercise #1 results (figure 14).
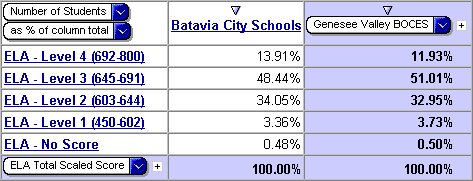
Figure 14
1. Place your mouse cursor (without clicking) over the Column Nesting button to the right of your BOCES name. A fly-out menu will appear (figure 15).

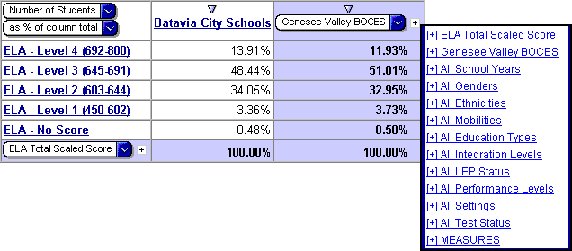
Figure 15
9.
Click the [+] All School Years link. Your results should look like figure 16.
ELA 4 Percentage Breakdowns by Level for each Year

Figure 16
Exercise # 3: Comparison of percentage breakdowns by Level for Regular Education and Special Education
Your starting point for this exercise is the Exercise #2 results (figure 17).

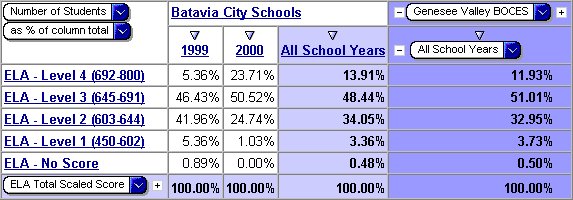
Figure 17
1.
Click the Nested Column Pulldown and select All Education Types (figure 18).
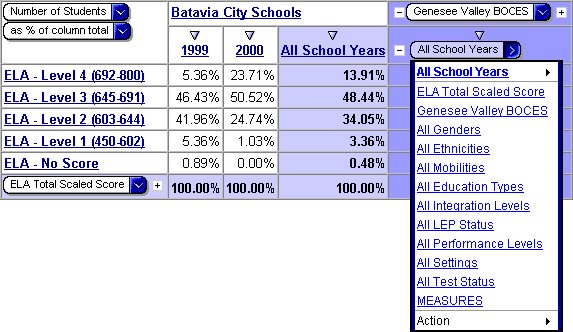
Figure 18
2.
Your results should look like figure 19.
ELA 4 Breakdown of Levels by Education Type
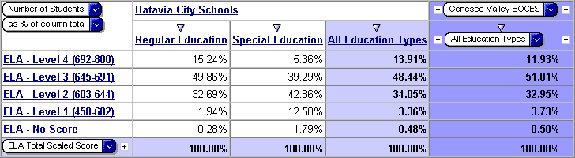
Figure 19
To see how Special Education students affect average scores, we need to know the count of Special Education students. Figure 20, our starting point, is the result of exercise 3.

Figure 20
3.
Click the Measure Type Pulldown and select “As Values”. Your results should look like figure 21.
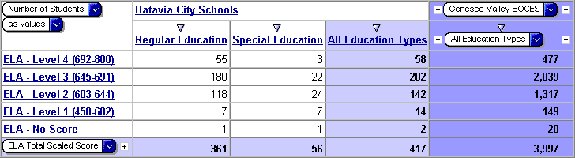
Figure 21
Exercise # 4: Regional comparison of percentage breakdowns by Level
Your starting point for this exercise is the Exercise #3 results (figure 22).

Figure 22
1.
Click the Delete Column Nesting button. Your results should look like figure 23.


Figure 23
2.
Click the Column Pulldown which currently lists your BOCES name. Place your mouse pointer over the All Districts choice, then the By County choice, then click your county name. For this example, we’re using Genesee (figure 24).
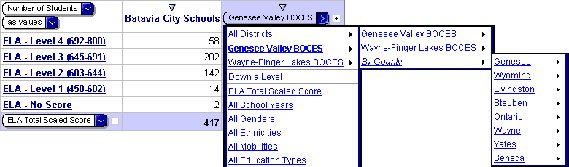
Figure 24
3.
Your results should look like figure 25.

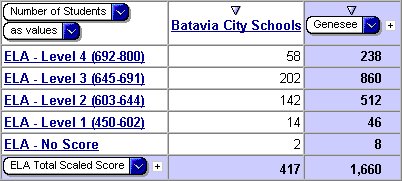
Figure 25
4.
Previously, we hid all schools except for ours. We now need to unhide those columns. Move your mouse pointer over your school name (column header). A fly-out menu will appear. From that menu, choose Action and then Hide/Show Columns from the next fly-out menu (figure 26).
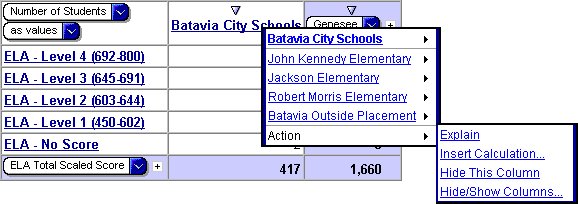
Figure 26

5.
From the form that appears (figure 27) click the Select All link. A check mark will appear to the left of each school district in your county. Click the OK button. Your results will look like figure 28.

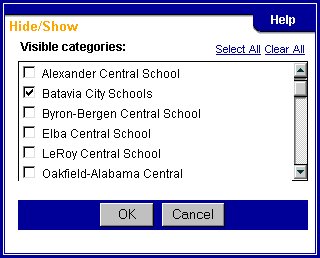
Figure 27
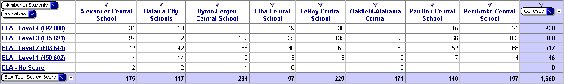
 Figure 28
6.
From the Measure Type Pulldown select as % of Column Total your results should look like figure 29.
County comparison of ELA 4 percentage breakdowns by Level
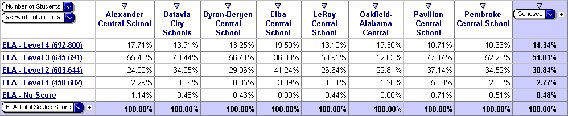
Figure 29
Exercise # 5: Average SPI (Standard Performance Indicator) for your school for each of the ELA Standards
Your starting point for this exercise is the Exercise #4 results (figure 30).

Figure 30

1.
Click the Column Pulldown and select by County
2.
Click the Column Pulldown, place the mouse pointer over All Districts. From the fly-out menu that appears, click your BOCES name. We’ll use Genesee Valley BOCES (figure 31).
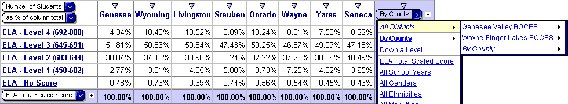
Figure 31

3.
Your results should look like figure 32.
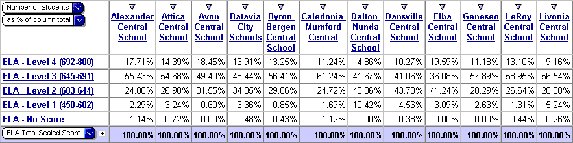
Figure 32
4.
Move your mouse pointer over your school name (column header). A fly-out menu will appear. From that menu, choose Action and then Hide/Show Columns from the next fly-out menu (figure 33).
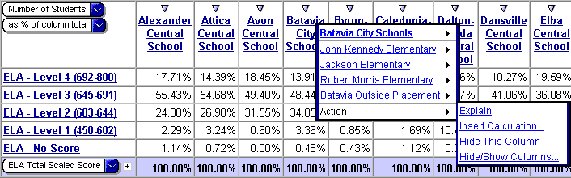
Figure 33
5.
A form similar to Figure 34 will appear.

Figure 34
Figure 34
6.
Click Clear All. The check box to the left of every school name will be cleared.
7.
Click the check box to the left of your school name. You may need to scroll down to your school.
8.
Click the OK button. Your results will look similar to figure 35.
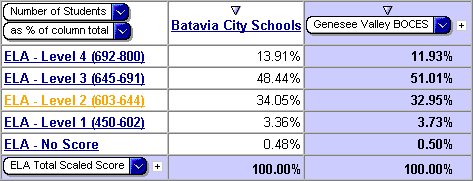
 Figure 35
9. From the Row Pulldown select Measures (figure 36).

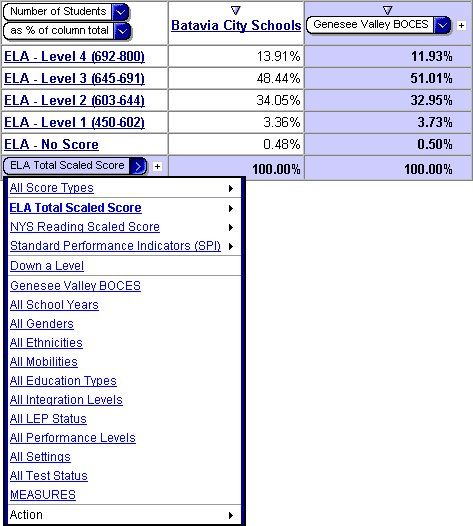
Figure 36
10.
Your results will look like figure 37.
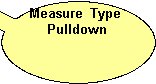
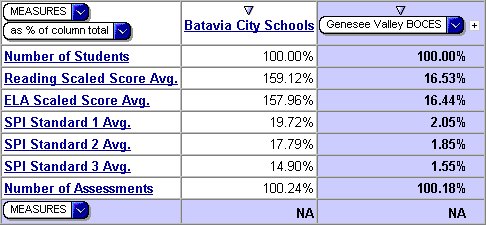
Figure 37
11.
Select As Values from the Measure Type Pulldown. Your results will look similar to figure 38.
12.
Move your mouse pointer over the row Number of Students. From the fly-out menu that appears move your mouse pointer to Actions and select Hide/Show Rows from the next fly-out menu that appears (figure 38)
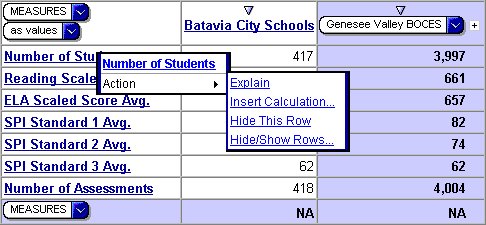
 Figure 38
13.
From the form that appears, click the Clear All link and then select the three SPI Standards (figure 39)
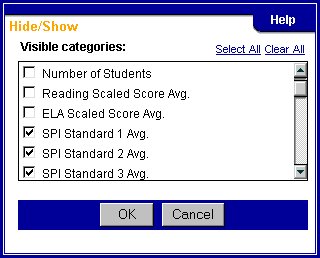
Figure 39
14.
Click OK. Your results should look like figure 40.
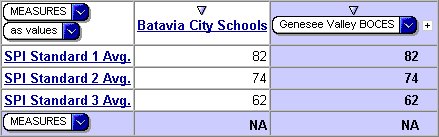
Figure 40
15.
Click the Swap button in the toolbar at the bottom of the screen (figure 41). Your results should look like figure 42.

Figure 41

Standard Performance Indicator Comparison to BOCES Average
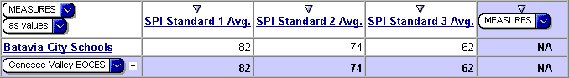
Figure 42
Back to top
- 1 -