
| Changing Measures…………………………………………………………...
|
3
|
| Filtering…….…………………………………………………………………...
|
5
|
| Drilling Down……………………………………….…………………………..
|
7
|
| Replacing a Dimension with Another Dimension…………………………..
|
9
|
| Nesting a Subcategory………………………………………………………..
|
11
|
| Removing a Nesting…………………………………………………………..
|
13
|
| Using Measures as a Dimension…………………………………………….
|
15
|
| Swapping Rows and Columns……………………………………………….
|
17
|
| Nesting Another Dimension…………………………………………………
|
19
|
| Swapping Nested Dimensions……………………………………………….
|
21
|
| Changing between Percentage of Rows and Columns……………………
|
23
|
| Changing between Percentages of Row/Column Subtotals……………..
|
25
|
| Suppressing Zeros…………………………………………………………….
|
27
|
| Preparing a Bookmark/Favorite………………………………………………
|
28
|

| A.
|
Show the percent of students at each performance level on the ELA 4 for each income group…………………………………………………
|
31
|
| B.
|
Show the percentage distribution of results for the 1999 Grade 4 Math test for your school district and compare it to the regionally summarized scores……………………………………………………….
|
34
|
| C.
|
Show a multi-year comparison of the PEP 5 writing data as well as an analysis of the performance of the different groups
of students based on their program services………………………………………..
|
37
|

| Definition of Terms…………………………………………………………….
|
41
|
| Tips and Tricks………………………………………………………………...
|
43
|
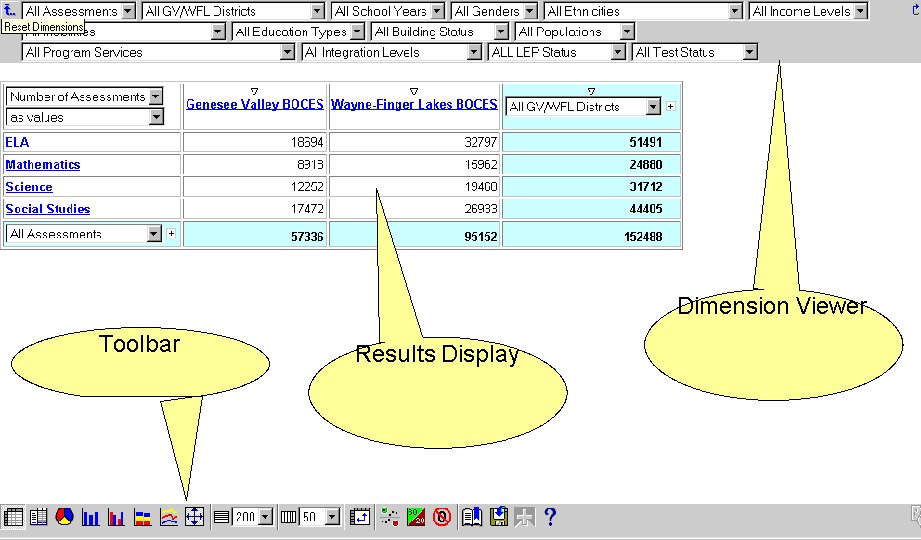
| Cognos Web Access Screen Diagram……………………………………...
|
45
|
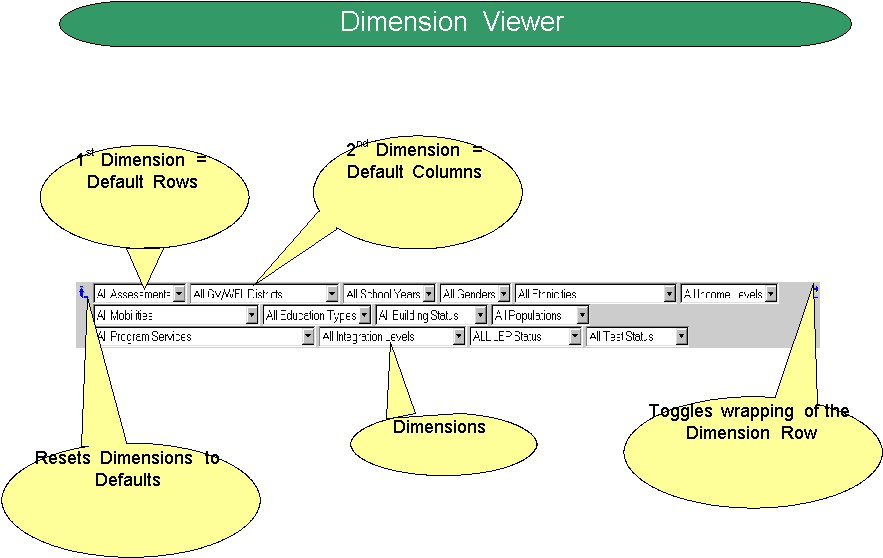
| Dimension Viewer Diagram…………………………………………………..
|
46
|
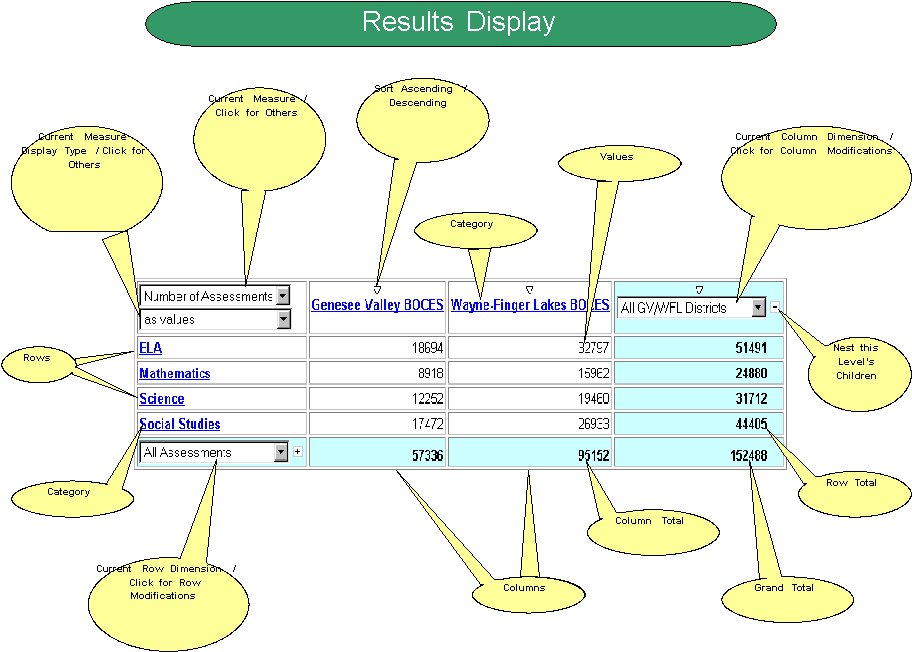
| Results Display Diagram……………………………………………………..
|
47
|
| Toolbar………………………………………………………………………….
|
48
|
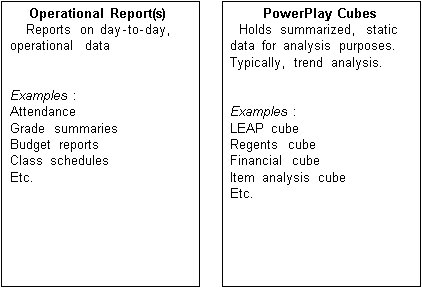
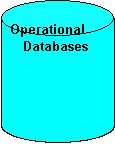
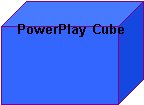
| Database and Cube Comparison……………………………………………
|
49
|
| 1998-1999 LEAP Record Layout…………………………………………….
|
50
|

| Changing Measures………………………………………….….
|
3
|
| Filtering……..……………………………………………..……...
|
5
|
| Drilling Down……………………………………………………..
|
7
|
| Replacing a Dimension with Another Dimension…………….
|
9
|
| Nesting a Subcategory………………………...………………..
|
11
|
| Removing a Nesting……………………………...……………..
|
13
|
| Using Measures as a Dimension…………...………………….
|
15
|
| Swapping Rows and Columns………...……………………….
|
17
|
| Nesting Another Dimension……...……………………………
|
19
|
| Swapping Nested Dimensions…...…………………………….
|
21
|
| Changing between Percentage of Rows and Columns..……
|
23
|
| Changing between Percentages of Row/Column Subtotals..
|
25
|
| Suppressing Zeros………………………………………………
|
27
|
| Preparing a Bookmark/Favorite………………………………..
|
28
|

Why?
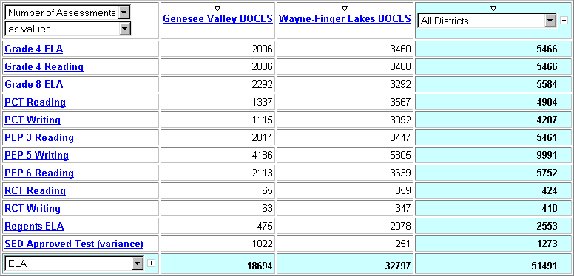
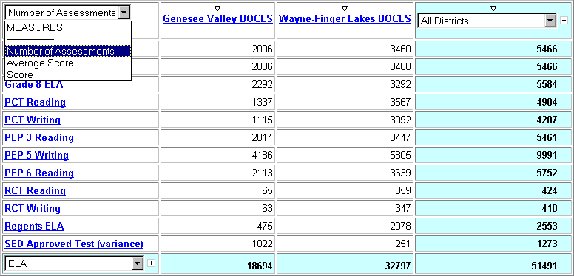
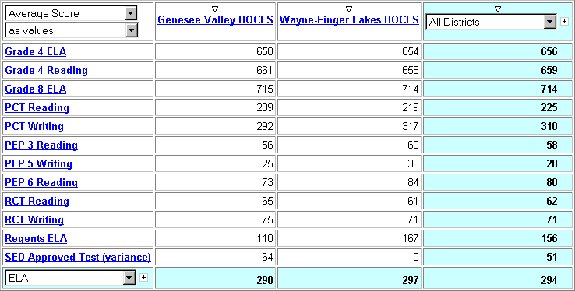
When we want to view a different measure (Number of Assessments or Average Score)
Example
�
We’re viewing the number of assessments by BOCES for Grade 4 Math
�
We’d like to see the average score by BOCES for Grade 4 Math
�
We need to change the measure from Number of Assessments to Average Score


 Why?
Why?
To view only data for an individual category of a Dimension
Example
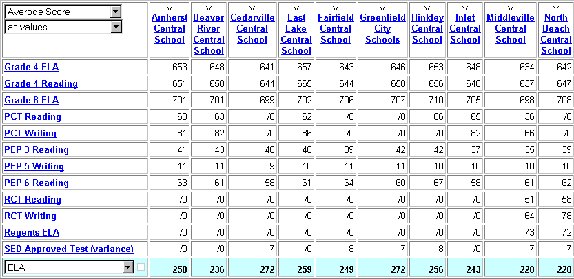
�
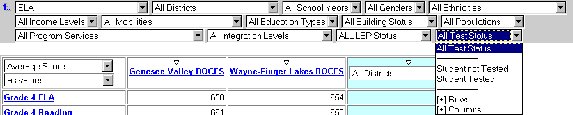
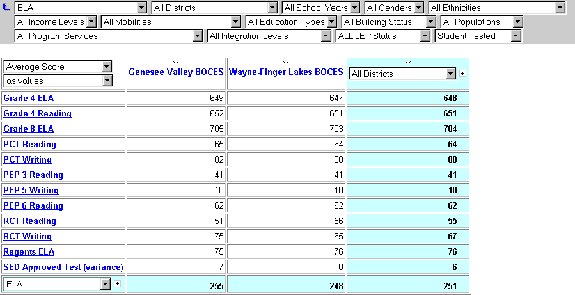
We’re viewing the average score of each ELA measure for each BOCES
�
We only want to include the scores of students who actually took the test
�
We need to filter the Test Status dimension


Useful Filters
�
Only one school district
�
Only one Subject Area or Measure
�
Only students tested
�
Only one school year

Why?
When we want to view more detailed results for a category by showing its sub-category instead
Example
�
We’re viewing the average score by BOCES for ELA exams
�
We’d like to see the scores for the districts in the Genesee Valley BOCES
�
We need to drill down on Genesee Valley BOCES


Why?
When we want to view results for another dimension (row or column), we need to replace that dimension
Example
�
We’re viewing the ELA average scores by Measure and School
�
We now want to view the ELA average scores by Income Level
�
We need to replace a dimension


 Why?
Why?
When we want to view more detailed results for all categories shown by also showing their subcategories
Example
�
We’re viewing the average score for Math assessments by Income Level
�
We’d like to see the number of assessments for the individual measures for Math
�
We need to nest the Measures


 Why?
Why?
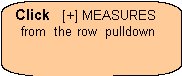
When we’re done viewing the results at the nested level
Example
�
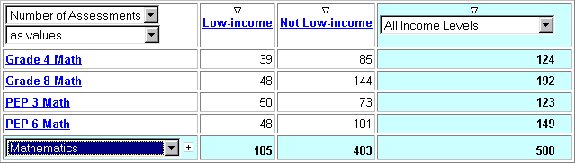
We’re viewing the number of assessments for the Math measures by Income Level
�
We’d like to see only the Math measures by Income Level
�
We need to remove a nesting


Why?
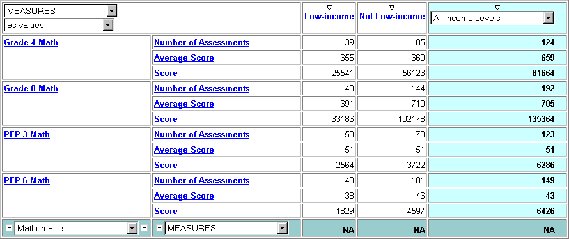
When we want to view multiple Measures at once. For instance, we want to view the number of assessments and the average score.
Example
�
We’re viewing number of assessments grouped by subject area and then by education type
�
We’d like to view the number of assessments and the average score at the same time for these same categories
�
We need to nest the measures


 Why?
Why?
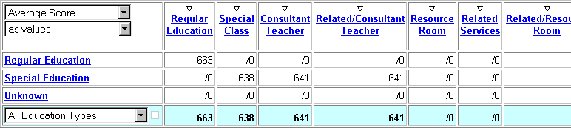
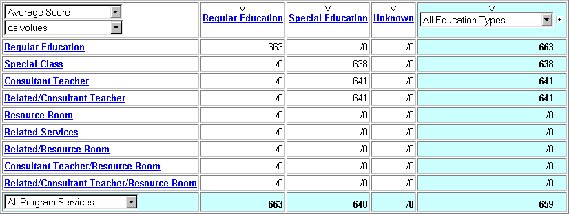
When we’d like to switch the rows with the columns to make analysis easier
Example
�
We’re viewing the average score of the Assessments by Education type and Program Services
�
We’d like to see more of the results on one page so we don’t have to scroll to the right to see the remainder of the view
�
We need to Swap Rows and Columns


 Why?
Why?
When we want to view more detailed results for all categories shown by detailing results by children for another dimension
Example
�
We’re viewing the average score for the ELA exam by Gender
�
We’d like to see the scores also grouped by Income Level
�
We need to nest the Income Level dimension


 Why?
Why?
When we want to change the grouping order in a set of nested dimensions
Example
�
We’re viewing ELA scores grouped by Gender and then Income level
�
We’d like to see the ELA scores by Income level and then Gender
�
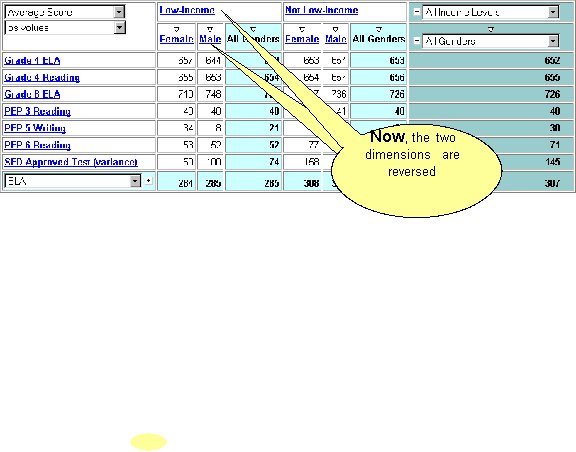
We need to swap the nested dimensions


Why?
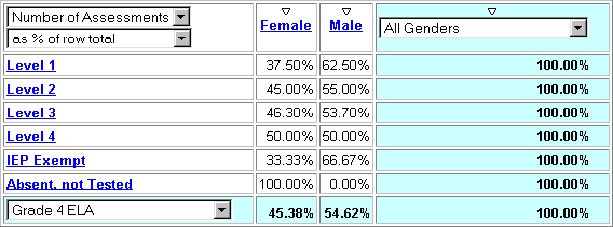
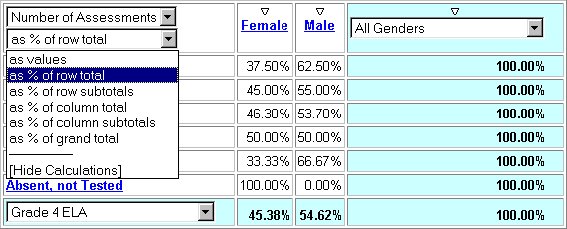
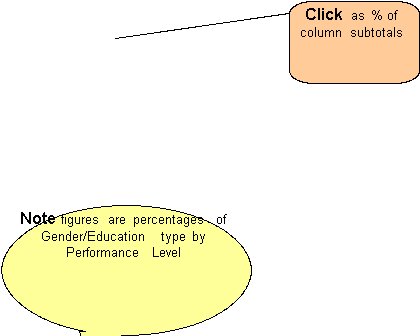
When we want to view the percentage of the measure of its column total or of its row total.
Example
�
We’re viewing percentages of ELA 4 assessments by Level grouped by gender
�
We’d like to see the percentages of assessments by Gender grouped by Level
�
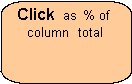
We need to change the measure display type to % of column total


Why?
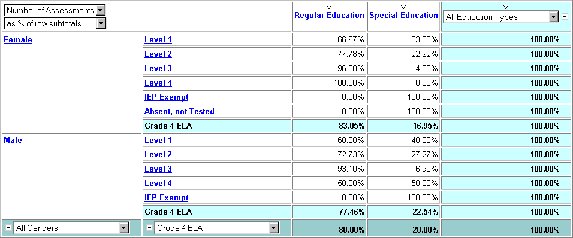
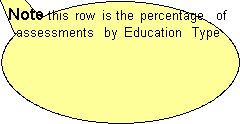
When we want to view the percentage of the measure of its column subtotal or of its row subtotal.
Example
�
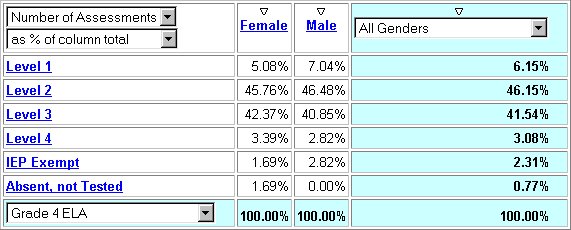
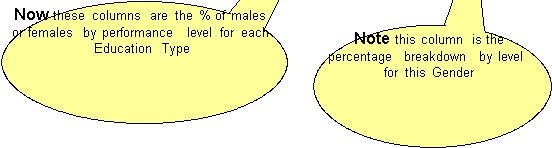
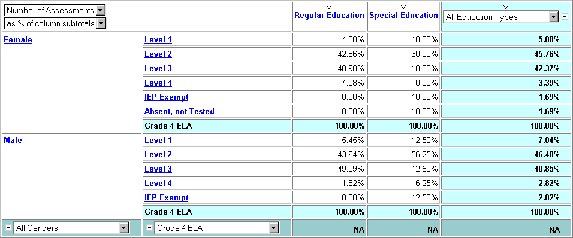
We’re viewing the percentage breakdown by Education Type for the Grade 4 ELA performance levels for each Gender
�
We’d like to see the percentage breakdown by Performance Level for each Education Type for each Gender
�
We need to change the measure display type to % of column subtotals


Why?
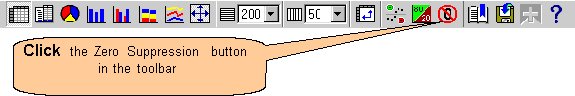
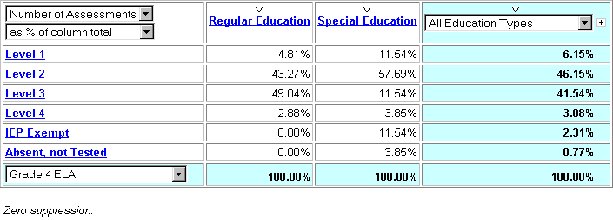
To eliminate categories whose measures are all zero
Example
�
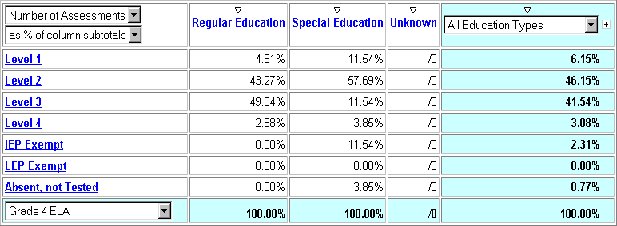
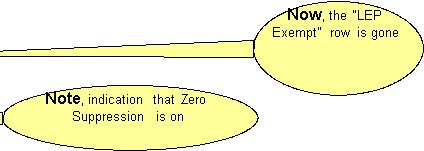
We’re viewing the performance of the ELA 4 by Education Type and we have no assessments in the LEP Exempt and no assessments for Unknown Education Types
�
We’d like to remove the LEP Exempt row and the Unknown Education Type column


Why?
When we want to save an analysis view for later use
Steps
1.
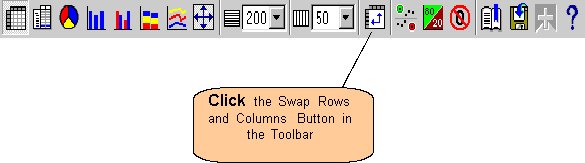
When you’ve found a view that you’d like to save, click the Prepare a Bookmark button in the toolbar


2.
Follow the steps for your browser to create a bookmark or favorite
Creating a Bookmark in Microsoft Internet Explorer:
1.
Click Add to Favorites from the Favorites menu
2.
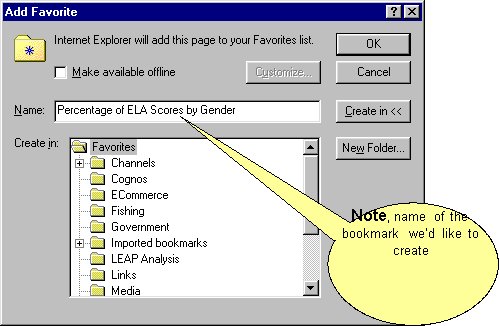
Type the name of the bookmark in the Name: box. In this example, we’re looking at Percentage of ELA Scores by Gender.

3.
Click the folder in which you’d like to create the bookmark. In this example, we’ll place the bookmark in the LEAP Analysis folder. Note that the folder appears “open” after selecting it.
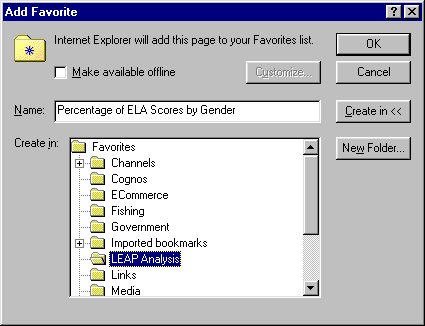

4.
Click OK to save the bookmark.
For Netscape Communicator
1.
Click Bookmarks from the Communicator menu
2.
Click Add Bookmark
3.
The bookmark is placed in bookmarks list but, not in a specific folder
4.
To move the bookmark to a different folder, click Bookmarks from the Communicator menu then click Edit Bookmarks. You can then drag the bookmark into an existing folder or create a new folder for the bookmark.
| A.
|
Show the percent of students at each performance level on the ELA 4 for each income group……………...………
|
31
|
| B.
|
Show the percentage distribution of results for the 1999 Grade 4 Math test for your school district and compare it to the regionally summarized scores……………………...
|
34
|
| C.
|
Show a multi-year comparison of the PEP 5 writing data as well as an analysis of the performance of the different groups of students based on their program services……………………………………………………….
|
37
|


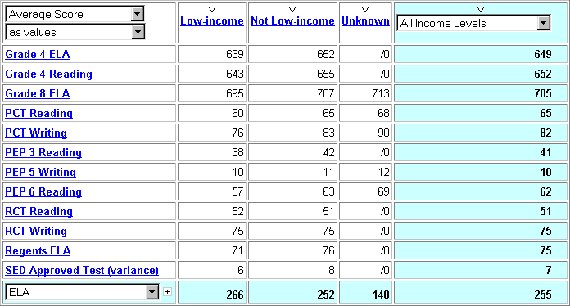
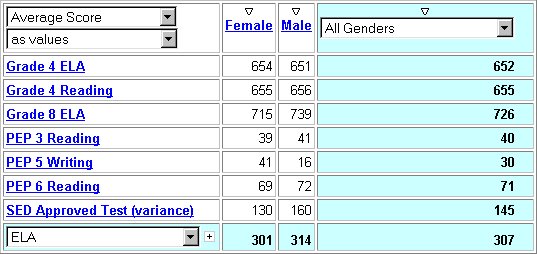
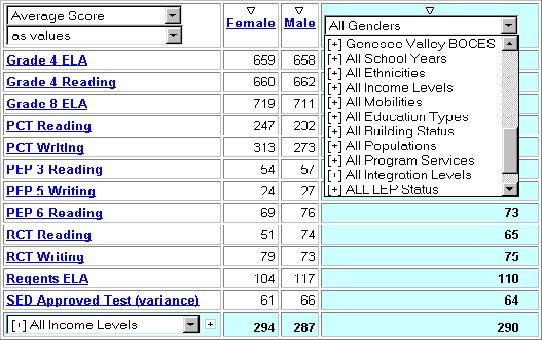
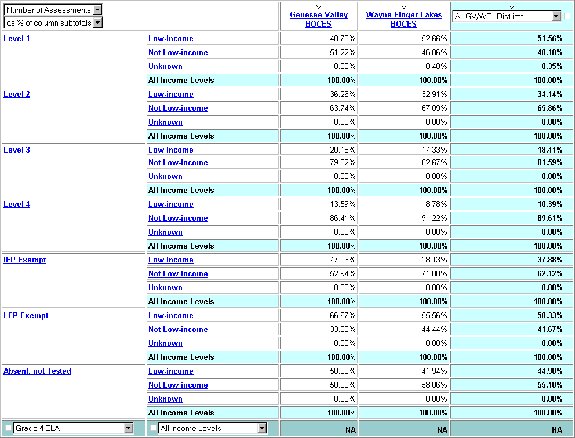
 Show the percent of students at each performance level on the ELA 4 for each income group.
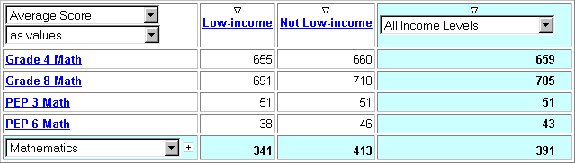
Your results should look like the following (note: your columns will be determined by your access level):
View next page for solutions
Questions
Of all of the Level 1 Assessments, what percent was from students noted as low-income?
At what level of assessment was the greatest percentage difference between each income level?
Going Further
Going Further
What percentage of assessments from Low Income students attained a Level 3?
Tasks
Tasks
Tasks
1.
Start with the Default View
2.
Drill down on ELA
3.
Drill down on ELA 4
4.
Nest the Income Level as rows
5.
Change the Measure Display Type to % of Column subtotal
Going Further Tasks
Going Further Tasks
1.  Swap the nested Row dimension

Step by Step Instructions
Step by Step Instructions
Back to top
Step by Step Instructions
1.
Start with the Default View
q
Start with Subject Areas as the Rows and your district(s) data as the columns
2.
Drill down on ELA
q
Click the ELA row in the Results View
3.
Drill down on ELA 4
q
Click the Grade 4 ELA row in the Results View
4.
Nest the Income Level as rows
q
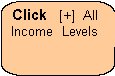
Click the [+] All Income Levels from the Row Dimension pulldown
5.
Change the Measure Display Type to % of Column subtotal
q
Click the As % of Column total from the Measure Display Type pulldown
Going Further Step by Step Instructions
Going Further Step by Step Instructions
1.  Swap the nested Row dimension
q
Click the Swap Left from the nested, Income Level row’s Row Dimension pulldown
 Show the percentage distribution of results for the 1999 Grade 4 Math test for your school district and compare it to the regionally summarized scores.
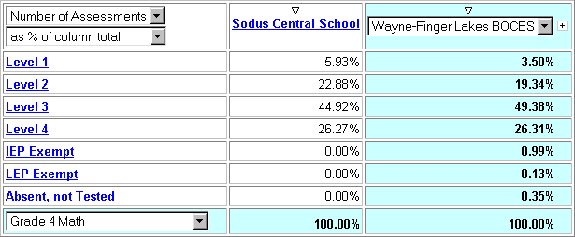 Your results should look similar to the following:

View next page for solutions
Questions
In which levels did students at your school perform better than the regional average?
In which levels did students at your school perform worse than the regional average?
Going Further
Going Further
Show the percentage distribution for each of the measures in the mathematics subject area in one display.
Or
Or
Show the percentage distribution for the Grade 4 Math results as a clustered bar graph.

Tasks
Tasks
1.
Start with the Default View
2.
Drill down on Mathematics
3.
Drill down on Grade 4 Math
4.
Filter year 1999
5.
Change to show measures as a % of Column Total
Going Further Tasks
Going Further Tasks
1.
Show all of the Mathematics measures as the outside row
2.
Nest the Mathematics sub-categories (results levels)
Back to top
Or
1.
Select clustered bar graph as the display

Step by Step Instructions
Step by Step Instructions
Back to top
Step by Step Instructions
1.
Start with the Default View
q
Start with Subject Areas as the Rows and your district(s) data as the columns
2.
Drill down on Mathematics
q
Click the Mathematics row in the Results View
3.
Drill down on Grade 4 Math
q
Click the Grade 4 Math row in the Results View
4.
Filter year 1999
q
Select 1999 as from the All Years pulldown in the dimension line
5.
Change to show measures as a % of Column Total
q
Select As % of Column total from the Measures Display type pulldown
Going Further Step by Step Instructions
Going Further Step by Step Instructions
Going Further Step by Step Instructions
Going Further Step by Step Instructions
1.
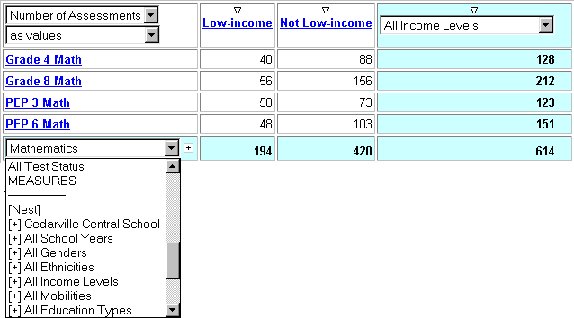
Show all of the Mathematics measures as the outside row
q
Drill down on Mathematics by clicking the Mathematics row in the Results View
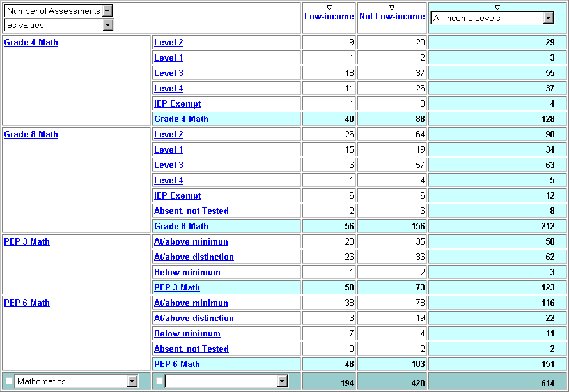
2.
Nest the Mathematics sub-categories (results levels)
q
Click the [Nest] from the Mathematics row’s Row Dimension pulldown
Back to top
Or
1.
Click the clustered bar graph button in the toolbar
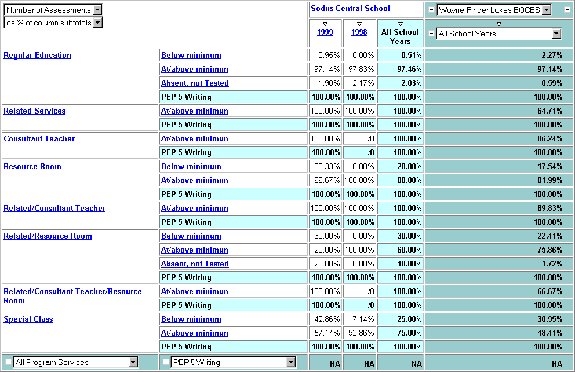
 Show a multi-year comparison of the PEP 5 writing data as well as an analysis of the performance of different groups of students based on their program services.
Your results should look like the following:
View next page for solutions
Questions
Of all of the PEP 5 Writing Assessments for students who were in the resource room for part of the day, what percent scored above the minimum?
Students participating in what program service realized the greatest decrease in performance on the PEP 5 writing measure?
Going Further
Going Further
Show a stacked bar graph of the percentage of students, for each year, using each program service grouped by whether the students met the minimum score. The graph should show how each program service contributed to the number of students who scored at each level.
Back to top
Tasks
1.
Start with the Default View
2.
Drill down on ELA
3.
Drill down on PEP 5 Writing
4.
Nest the Years dimension as columns
5.
Nest the Program Services dimension as Rows
6.
Change the Measure Display Type to % of Column Subtotal
7.
Swap the nested row dimension
8.
Eliminate the rows that have zeros in all columns
Going Further Tasks
Going Further Tasks
1.  Swap the nested Row dimension again
2.
Change the display to a Stacked Bar Graph

Step by Step Instructions
Step by Step Instructions
1.
Start with the Default View
q
Start with Subject Areas as the Rows and your district(s) data as the columns
2.
Drill down on ELA
q
Click the ELA row in the Results View
3.
Drill down on PEP 5 Writing
q
Click the PEP 5 Writing row in the Results View
4.
Nest the Years dimension as columns
q
Click the [+] All Years from the Row Dimension pulldown
5.
Nest the Program Services dimension as Rows
q
Click the [+] All Program Services from the Row Dimension pulldown
6.
Change the Measure Display Type to % of Column Subtotal
q
Select As % of Column total from the Measures Display type pulldown
7.
Swap the nested row dimension
q
Click the Swap Left from the nested, Program Services row’s Row Dimension pulldown
8.
Eliminate the rows that have zeros in all columns
q
Click the Zero Suppression button on the toolbar
Going Further Step by Step Instructions
Going Further Step by Step Instructions
1.
Swap the nested Row dimension again
q
Click the Swap Left from the nested, Score level row’s Row Dimension pulldown
2.
Change the display to a Stacked Bar Graph
q
Click the Stacked Bar Display button on the toolbar

| Definition of Terms………………………………………..…….
|
41
|
| Tips and Tricks……………………………………………..…...
|
43
|
| Cognos Web Access Screen Diagram…………………..…...
|
45
|
| Dimension Viewer Diagram………………………………..…..
|
46
|
| Results Display Diagram…………………………….……..…..
|
47
|
| Toolbar…………………………………………………….….….
|
48
|
| Database and Cube Comparison……………………...………
|
49
|
| 1998-1999 LEAP Record Layout……………………..……….
|
50
|

Data Analysis
�
Make informed decisions by analyzing your school’s data
�
Explore data from different angles and gain new insights
�
Find faster answers to Education-delivery questions
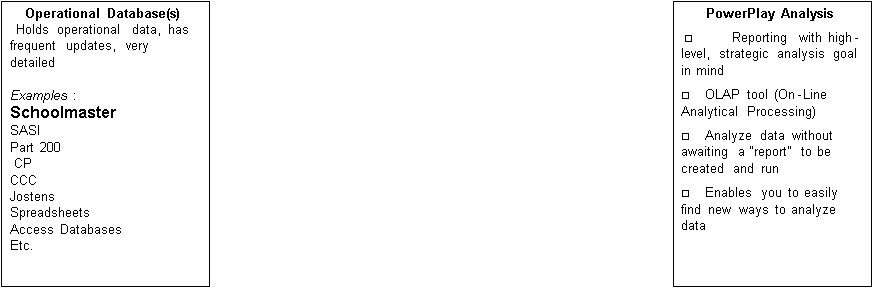
Cube
: A collection of related data on which you can perform analysis. The LEAP data resides in a cube
Dimension
: a grouping of data that defines something you’re analyzing
Examples:
�
LEP
�
Building
�
Regular or Special Ed.
�
Mobility
�
Gender
Measure
: performance indicators of the data that you’re analyzing
Examples:
�
Score on a test
�
Number of days absent
�
Number of students exempted from a test
�
Amount of budget spent on each program
�
Percentage of students requiring special services
Multidimensional Analysis
: analyzing school performance across different dimensions
Examples:
�
Percentage of students at each performance level on the ELA-4 for each income group
�
Percentage of Special Ed. students at each Performance level of the ELA by level of integration
�
Percentage of students by integration level exempted from each ELA test

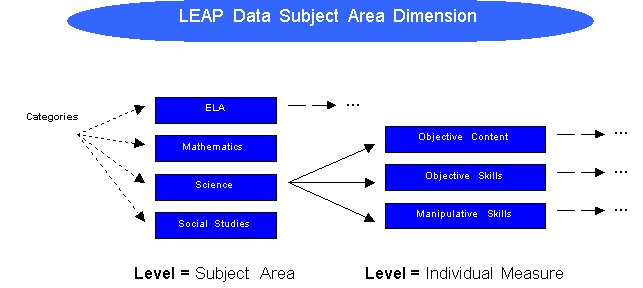
Levels and Categories
:
�
Data is organized into dimensions and stored in a hierarchy of levels
�
A category is a data item that exists in a level

q
When viewing Average Scores, make sure you filter for “Students Tested” from the “All Test Status” dimension.
q
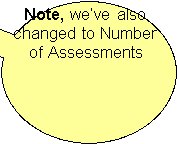
When viewing Number of Assessments, use the “All Test Status” dimension to select whether your analysis will include: only students tested, only students not tested, or both.
q
All tasks that can be performed for rows (filtering, nesting, swapping, etc.) can also be performed for columns, and vice versa.
q
You only have access to the data appropriate to you. For district personnel, only your school is available for analysis. For BOCES personnel, only your BOCES (at an aggregate level) is available for analysis.
q
The “Score” measure is of little use
q
PowerPlay Web is best viewed at a monitor resolution of at least 800 by 600.
q
No student-level data is available in this cube.
q
Use bookmarks to get back to your favorite reports.
q
You must “Prepare a Bookmark” before you use your browser to create a bookmark
q
Use Excel to perform further data manipulation, if needed. Save your results to a .CSV (comma separated values) formatted file and import it into Excel.
q
“/0” (division by zero) usually means that the value is zero.
q
Use your browser’s Back button to go back to a previous view.
q
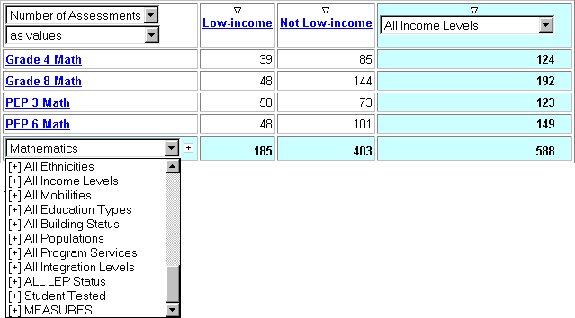
To nest rows (or columns), you can use the [+] Rows (or [+] Columns) from the dimension in the dimension line or you can choose [+] DimensionName from the Row (or Column) Dimension pulldown


Back to top
1 Crosstab display (default) 10 Limits # of Columns per page
Back to top
2 Indented Crosstab display 11 Swaps Rows and Columns
Back to top
3 Pie Chart 12 Applies Exception highlighting
Back to top
4 Bar Chart 13 Applies 80/20 suppression
Back to top
5 Clustered Bar Chart 14 Applies Zero suppression
Back to top
6 Stacked Bar Chart 15 Prepares a bookmark
Back to top
7 Multiline Chart 16 Saves to .CSV format
Back to top
8 Fit chart displays to page 17 Drills through to another report
Back to top
9 Limits # of Rows per page 18 Opens the Help window
 Operational Database(s)


 Positions 1 – 30
|
BEDS Building Code
(Use ‘0999’ as last four digits for students serviced out-of-district; use 0888 as last four digits for home-schooled students.)
|
Year
|
Bldg. Status
|
Funding
|
Student ID Number
|
Positions 31 – 54
|
|
55 – 56
|
Date of Birth
Y Y Y Y M M D D
|
Grade
Level
|
Gender
|
Ethnicity
|
Poverty
|
Population
|
Mobility
|
Disability
|
Program Services
|
Level of Integration
|
Service Provider
Complete for students placed out-of-district
|
|
LEP
Status
|
Yrs enrolled in
BE or ESL pgm
|
 Subject Subject
|
Measure
|
Assmt
Language
|
Date of Administration
|
Score
|
Standard Met
|
| |
|
|
Y Y Y Y M M
|
|
|
Back to top