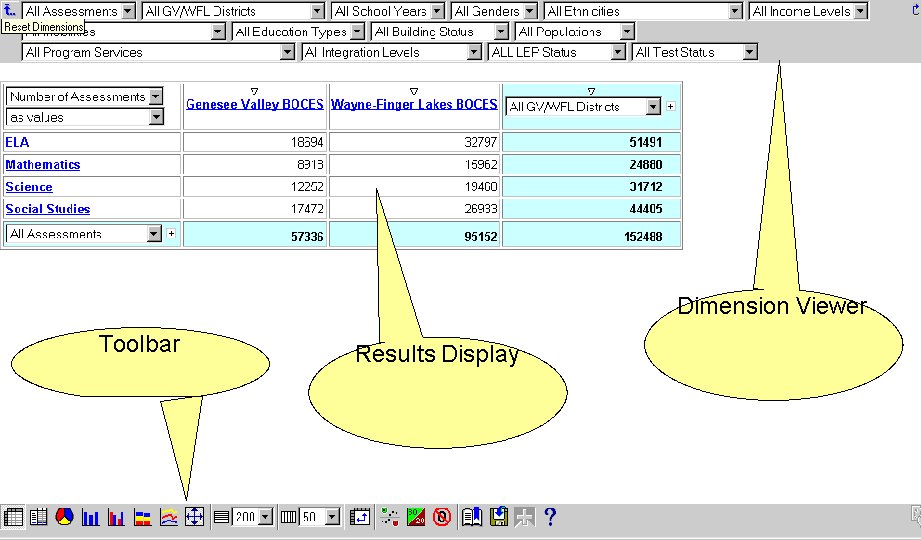
| | - 1 Crosstab display (default) 10 Limits # of Columns per page
- 2 Indented Crosstab display 11 Swaps Rows and Columns
- 3 Pie Chart 12 Applies Exception highlighting
- 4 Bar Chart 13 Applies 80/20 suppression
- 5 Clustered Bar Chart 14 Applies Zero suppresion
- 6 Stacked Bar Chart 15 Prepares a bookmark
- 7 Multiline Chart 16 Saves to .CSV format
- 8 Fit chart displays to page 17 Drills through to another report
- 9 Limits # of Rows per page 18 Opens the Help window
|