| |
A |
B |
C |
D |
E |
F |
G |
H |
I |
J |
K |
| 1 |
|
|
1996-97 |
Comparative Ranking RCS to All NYS Schools |
|
|
|
| 2 |
|
|
|
|
|
|
|
|
|
|
|
|
| 3 |
|
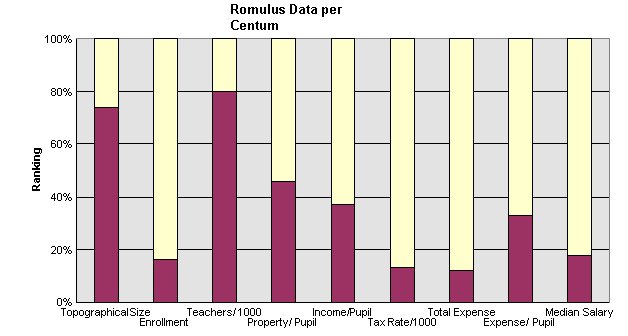
If you lined up every school District in New York from top to
bottom in the following categories |
|
|
|
| 4 |
|
Romulus would show up this far down this list in each of these
selected factors. |
|
|
|
|
| 5 |
|
|
|
|
|
|
|
|
|
|
|
|
| 6 |
|
Category |
|
Rank per 100 |
|
Raw Data |
Median |
Rank |
|
|
|
| 7 |
|
Topographical Size |
74 |
26 |
|
87.26 sq. mi. |
53.7 |
178/683 |
0 |
|
|
| 8 |
|
Enrollment |
16 |
84 |
|
621 |
1639 |
577/683 |
0 |
|
|
| 9 |
|
Teachers/ 1000 |
80 |
20 |
|
77 |
70 |
136/673 |
0 |
|
|
| 10 |
|
Property/ Pupil |
46 |
54 |
|
$ 186,122 |
$ 203,576 |
369/683 |
0 |
|
|
| 11 |
|
Income/Pupil |
37 |
63 |
|
$ 51,480 |
$ 60,808 |
432/683 |
0 |
|
|
| 12 |
|
Tax Rate/1000 |
13 |
87 |
|
$12.19 |
$16.68 |
595/683 |
0 |
|
|
| 13 |
|
Total Expense |
12 |
88 |
|
$ 5,785,870 |
$ 15,276,826 |
604/683 |
0 |
|
|
| 14 |
|
Expense/ Pupil |
33 |
67 |
|
$ 8,351 |
$ 9,152 |
461/683 |
0 |
|
|
| 15 |
|
Median Salary |
18 |
82 |
|
$ 38,919 |
$ 45,816 |
466/565 |
0 |
|
|
| 16 |
|
|
|
|
| 17 |
|
|
|
| 18 |
|
|
|
| 19 |
|
|
|
| 20 |
|
|
|
| 21 |
|
|
|
| 22 |
|
|
|
| 23 |
|
|
|
| 24 |
|
|
|
| 25 |
|
|
|
| 26 |
|
|
|
| 27 |
|
|
|
| 28 |
|
|
|
| 29 |
|
|
|
| 30 |
|
|
|
| 31 |
|
|
|
| 32 |
|
|
|
| 33 |
|
|
|
| 34 |
|
|
|
| 35 |
|
|
|
| 36 |
|
|
|
|
|
|
|
|
|
|
|
|
| 37 |
These data indicate that: |
|
|
|
|
|
|
|
|
|
| 38 |
|
Romulus covers more ground than 7 out of 10 school districts (
affects transportation costs) |
|
|
|
| 39 |
|
Romulus has fewer students than 84% of the State's Districts (
although 16% are smaller than us) |
|
|
|
| 40 |
|
Romulus has a lower student to teacher ratio than 8 out of 10
schools |
|
|
|
|