T
he State has recently issued its second annual public report on the achievement of schools, called the School Report Card. This report, available for every school building in the State, is meant to raise public awareness of and accountability for the way a district spends its money and the way its students perform. This year, School Report Card Day was March 9, when all school data from across the State was made public.
In the School Report Card, student performance on a variety of State examinations is given, allowing citizens to see how students in particular schools are doing, and how that school’s performance compares to other schools. “Comparable school” data supplied by the State compares RCS to all schools of “average ability to pay” and “average need of student” based on the income per capita in the District and the number of children on free and reduced lunch. Geography and school size were not factors in the comparable school calculation, therefore RCS was compared to places such as Canandaigua, Greece and Hilton, Rochester area communities which would normally be considered of a different, more suburban and affluent nature than Romulus. Despite our grouping with these and similar schools, our results are highly favorable.
At Romulus, we are pleased that the State has offered a clear picture of school performance through the use of the School Report Cards, and we welcome the opportunity to show that dollar for dollar, an RCS education is the equal of any. With the speculation which has persisted for years regarding the viability of small schools such as ours, it is pleasing to note the high level of performance of our program.
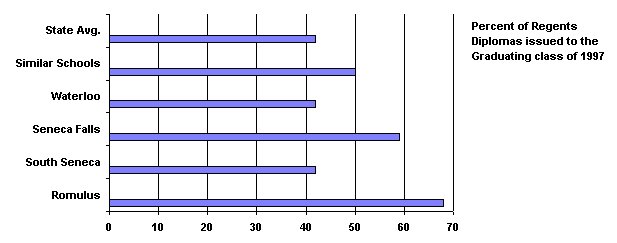
One of the most outstanding statistics on both editions of the School Report Card issued to date is the percentage of students graduating from Romulus with Regents Diplomas. This is a result of a commitment to all- Regents programming begun in the early 1990’s. The Regents Diploma rate at Romulus has climbed in each of the past four years from 36% in 1994, to 55% in 1995, and to 65% last year, when we ranked 87th in the State in this measure. This year our 68% places us 47th in the State out of over 850 high schools!
Back to top
RCS RANKED 47th IN NEW YORK STATE in REGENTS DIPLOMA RATE!
Back to top
COMPARATIVE DATA FOR SENECA COUNTY SCHOOLS
T
he data below compare the District-wide results of Romulus to our neighbors, to comparable schools, and to State averages based on the second edition of the School Report Card for each of the measures provided by the State. Details of each school’s performance may be found on their individual Report Cards or on the web at www.nysed.gov
.
| |
Romulus
|
South Seneca
|
Seneca Falls
|
Waterloo
|
“Similar” Schools
|
State Average
|
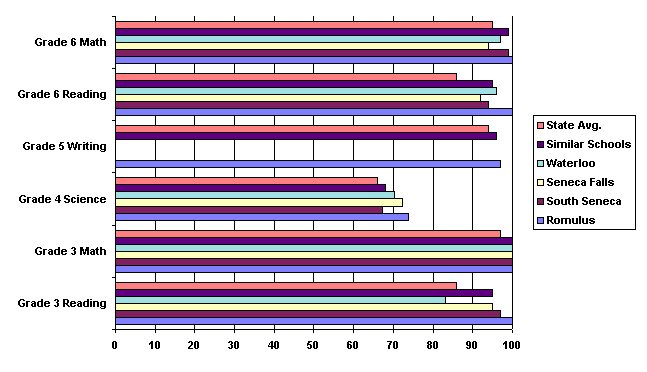
| Grade 3 Reading
|
100
|
97
|
95
|
83
|
95
|
86
|
| Grade 3 Math
|
100
|
100
|
100
|
100
|
100
|
97
|
| Grade 4 Science
|
73.9
|
67.3
|
72.3
|
70.3
|
67.9
|
66
|
| Grade 5 Writing
|
97
|
*
|
*
|
*
|
96
|
94
|
| Grade 6 Math
|
100
|
99
|
94
|
97
|
99
|
95
|
| Grade 6 Reading
|
100
|
94
|
92
|
96
|
95
|
86
|
| Grade 6 Social Studies
|
47.3
|
44.3
|
43.6
|
43.7
|
46.3
|
43.1
|
| Grade 8 Social Studies
|
53.4
|
48.1
|
49.7
|
53.2
|
50.7
|
46.7
|
| % Regents Diplomas
|
68
|
42
|
59
|
42
|
50
|
42
|
| Regents English % Passing
|
68 ( 82)
|
57 (56)
|
74 (71)
|
42 (47)
|
69
|
56
|
| Mastery
|
8
|
14
|
35
|
20
|
22
|
17
|
| Regents LOTE ( F Lang.) Passing
|
30 ( 36)
|
23 ( 22)
|
72 (69)
|
50 (56)
|
53
|
48
|
| Mastery
|
3
|
13
|
51
|
26
|
28
|
29
|
| Regents Course I Math -% Pass
|
61 (57)
|
53 (52)
|
84 (82)
|
55 (44)
|
58
|
59
|
| Mastery
|
29
|
26
|
40
|
23
|
26
|
29
|
| Regent Course III Math - % Pass
|
20 (24)
|
44 (43)
|
52 (50)
|
35 (39)
|
43
|
36
|
| Mastery
|
0
|
16
|
37
|
24
|
24
|
20
|
| Regents Biology % Passing
|
71 (64)
|
32 (34)
|
77 (77)
|
49 (46)
|
58
|
44
|
| Mastery
|
15
|
5
|
34
|
13
|
19
|
15
|
| Regents Chemistry- Passing
|
30 (36)
|
31 (30)
|
44 (42)
|
28 (31)
|
39
|
33
|
| Mastery
|
8
|
5
|
17
|
18
|
14
|
12
|
| Regents Global Studies- % Pass
|
61 (57)
|
67 (71)
|
61 (62)
|
45 (43)
|
60
|
48
|
| Mastery
|
23
|
18
|
19
|
9
|
17
|
14
|
| Regents US History - % Pass
|
71 (85)
|
46 (44)
|
64 (62)
|
40 (44)
|
59
|
48
|
| Mastery
|
13
|
14
|
25
|
18
|
19
|
15
|
| Intro to Occupations
|
63
|
92
|
100
|
93
|
90
|
78
|
| Free & Reduced Lunch
|
12.5
|
29.7
|
23.4
|
17.9
|
*
|
37.3
|
| Limited English
|
0.0
|
0.0
|
0.1
|
.01
|
*
|
7.9
|
| Expenditure/ Pupil - Total
|
8,384
|
7,319
|
7,141
|
7,835
|
*
|
9,255
|
| Approved Operating Expense / Pupil
|
5,013
|
5,282
|
4,757
|
5,091
|
*
|
6,095
|
| Attendance Rate for the District
|
96.2
|
94.3
|
96.1
|
95.4
|
91.2
|
91.4
|
| Suspension Rate for the District
|
1.9
|
10.7
|
3.4
|
3.4
|
2.7
|
4.5
|
| Drop out Rate for the District
|
0.6
|
2.6
|
3.2
|
4.7
|
2.0
|
3.7
|
| Pupils per Teacher
|
12.7
|
13.3
|
14.4
|
13.1
|
*
|
*
|
* Data not reported
**
Items in parenthesis indicate the % derived by dividing the # passing by the actual grade enrollment per school.
These data indicate that RCS students perform well compared to other area schools, that our attendance rate is high, our suspension and drop-out rates are low, and that our cost per pupil is comparable to neighboring Districts. It might be important to note that the percentage of children on free and reduced lunch is the lowest in the county, as this is a “need” factor identified by the State. Overall, Romulus fared very well on the second edition of the New York State School Report Cards. While there are areas which will require our attention and improvement, most areas of student achievement are at or above regional and state norms. The pupils per teacher number listed is derived by totaling the reported numbers for all schools in all Districts. That number indicates that Romulus class sizes are only slightly smaller than our neighbors.
Back to top
ELEMENTARY RESULTS
D
ata about the performance of our elementary students is uniformly positive and strong. While the State program of testing is due to change at these grade levels, the pattern of Romulus student’s performance on State examinations at grades 3 - 6 over the past three years has been excellent. This year’s report card continues that trend.
Back to top
HIGH SCHOOL RESULTS
D
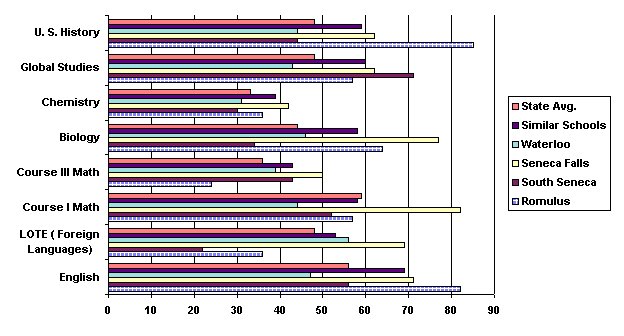
ata about the performance of high school juniors, the bulk of the Regents testing done, is misleading this year for our school because of the method the State has chosen to report the data and because of an abnormally small junior class. Instead of dividing the number of students passing a typically “ junior” test such as Comprehensive English, by the number of juniors at our school ( 33 last year), the State has decided to use the average grade level enrollment for the whole school ( 40) as the denominator. This means that if every one of our 33 juniors passed the Regents exam in English last year ( and 27 of them DID), the highest percentage passing the State would be able to report for us would be an 83% ( if everybody passed). With 27 of 33 possible juniors passing the exam, the accurate figure reported should be 82%. Instead, because the State chose to use an arbitrary and higher figure as the denominator, we show up as though only 68% of our juniors passed this test. Ironically, that’s still pretty good compared to 69% and 56% of the students in “similar” schools and across the State respectively - though our accurate 82% is a lot better.
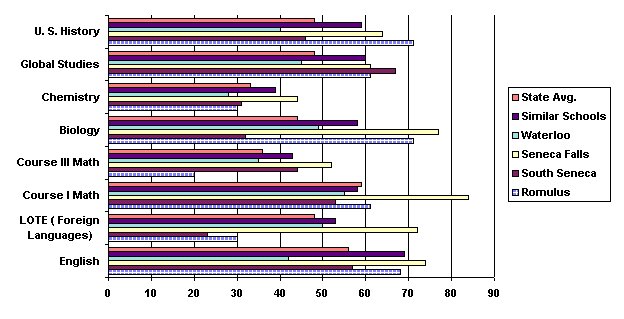
The charts below graph the performance of Romulus students compared to neighboring schools, “comparable” schools, and Statewide schools using two categories of data. The first shows the average enrollment used in calculating the data the way the State reported it. The second chart shows what the more accurate grade level enrollment would produce for Seneca County schools using the number of students passing the test and the actual grade level enrollment at each school for the year the test is typically given.
Back to top
% PASSING USING “AVERAGE” ENROLLMENT
Back to top
% PASSING USING GRADE LEVEL ENROLLMENT
Back to top
COST FACTORS
The State Report Card also features information on school spending.
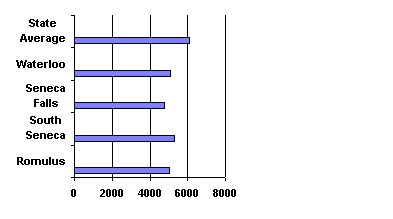
The chart to the right shows our per pupil approved operating expense compared to that of our neighbors. “AOE” is a technical term used to compare day-to-day costs of schools, excluding transportation, building costs and BOCES, which are aided separately.
Back to top