| | - By Tim Thomas
- Parameters Compared:
- Characteristics of each parameter:
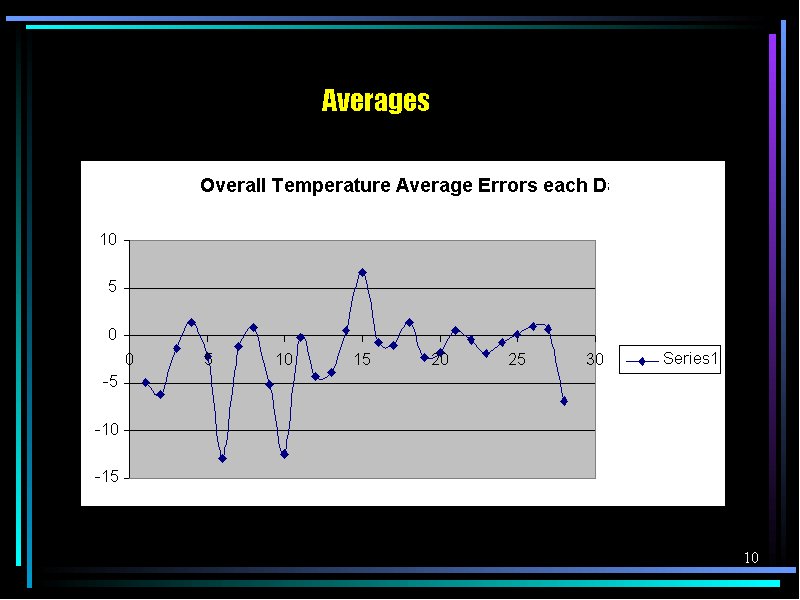
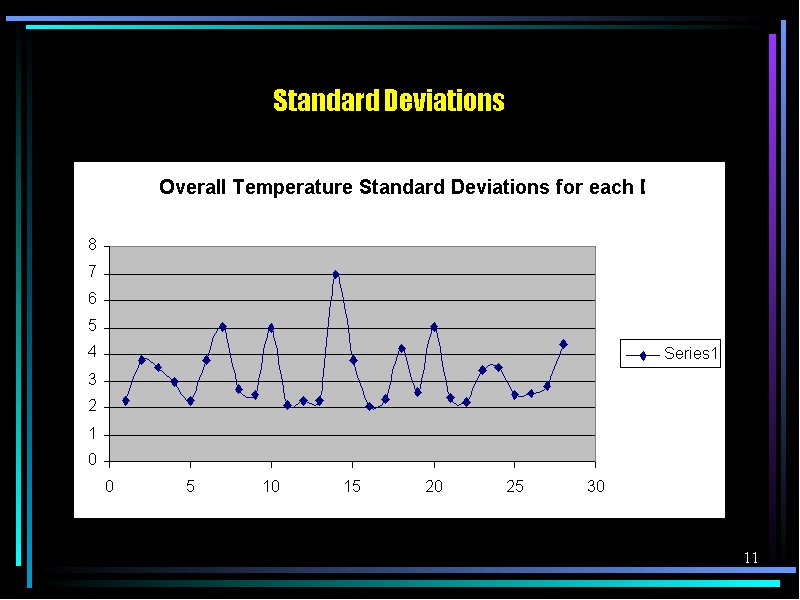
- Statistics
- Slide 5
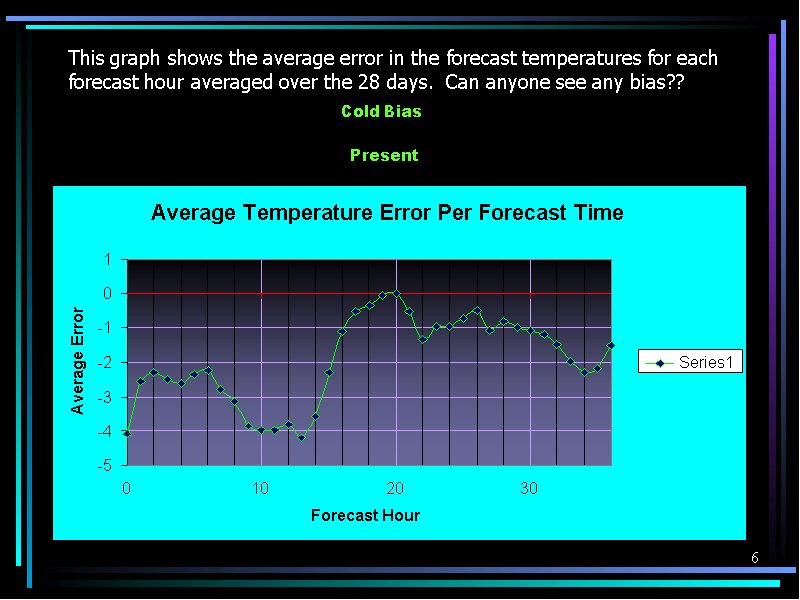
- This graph shows the average error in the forecast temperatures for each forecast hour averaged over the 28 days. Can anyone see any bias??
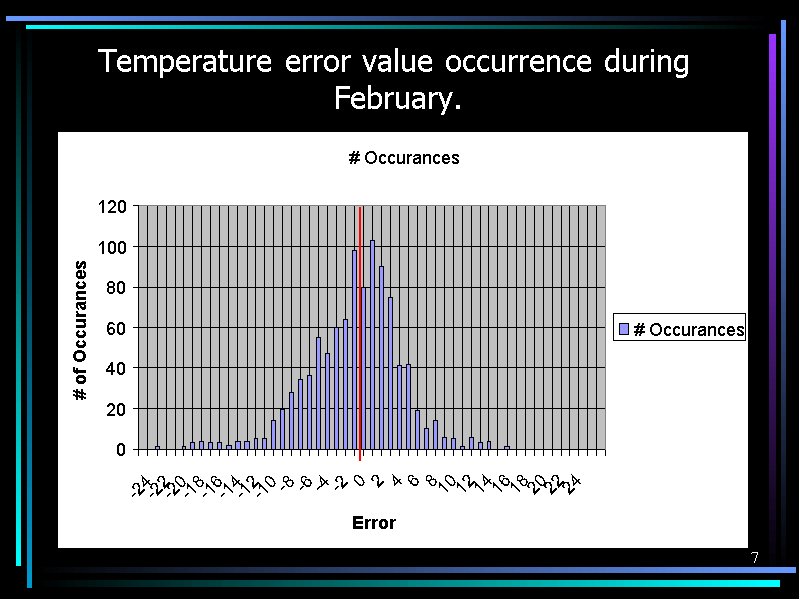
- Temperature error value occurrence during February.
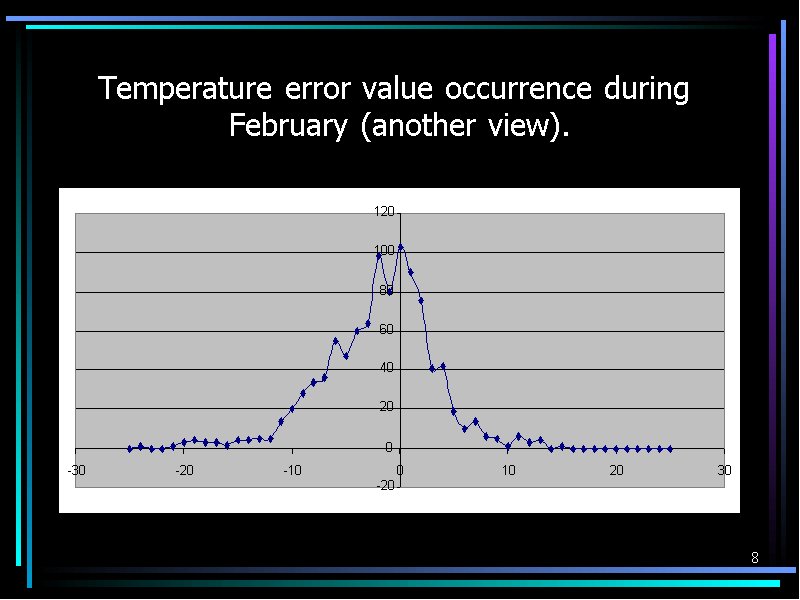
- Temperature error value occurrence during February (another view).
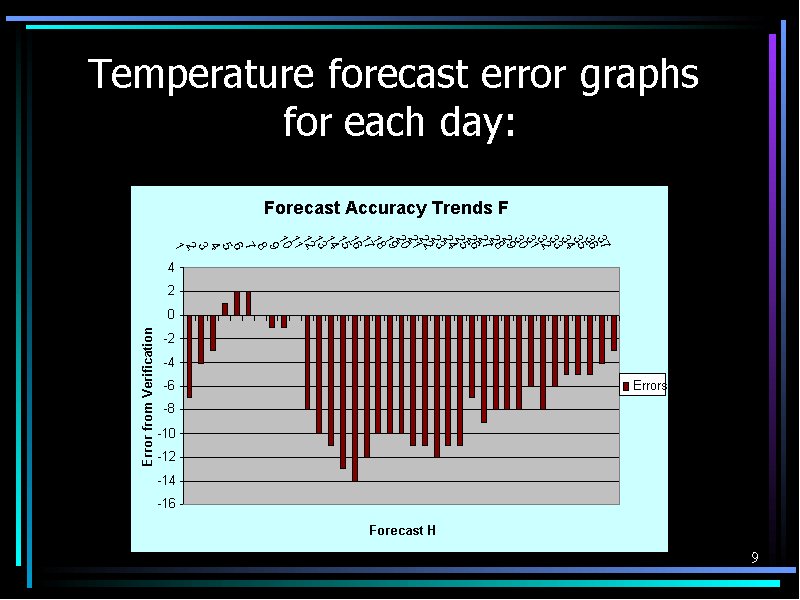
- Temperature forecast error graphs for each day:
- Slide 10
- Slide 11
- Slide 12
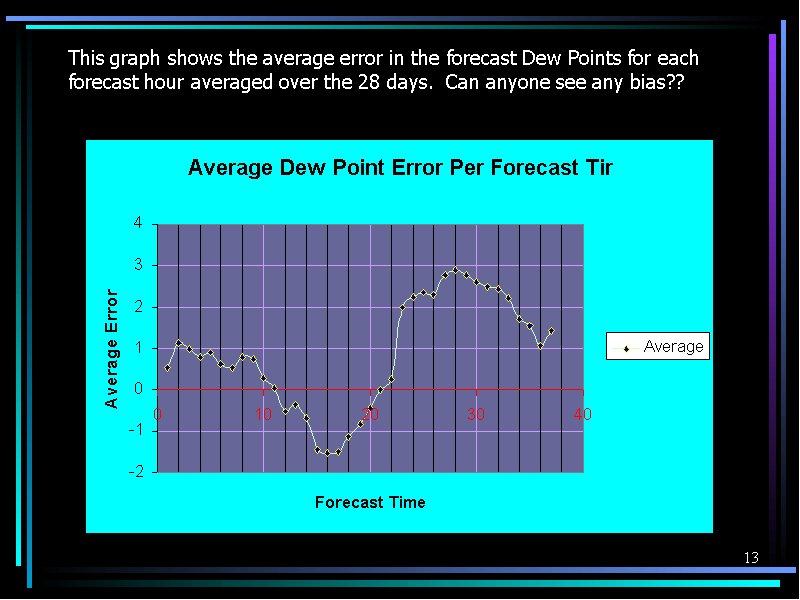
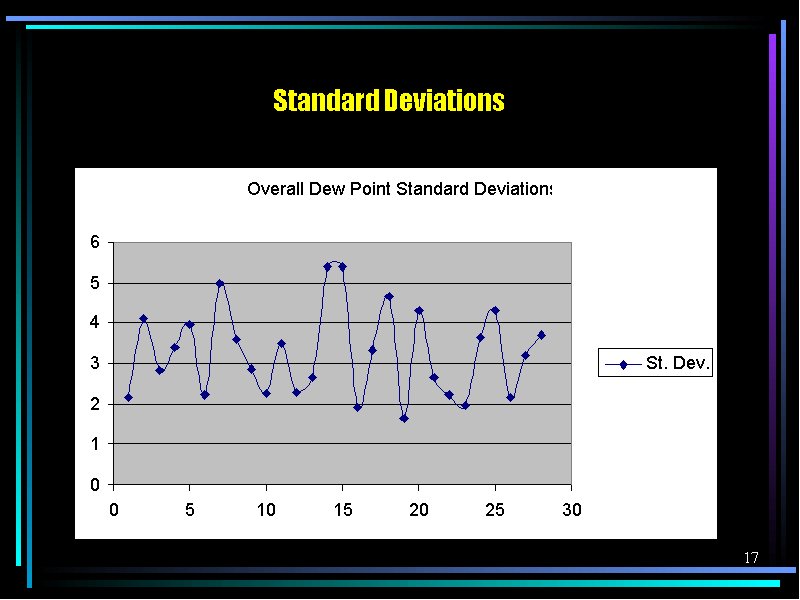
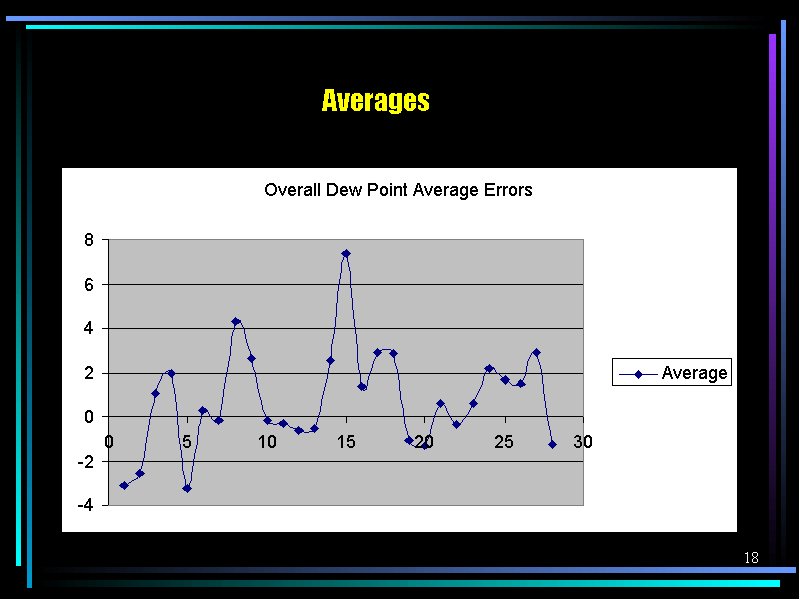
- This graph shows the average error in the forecast Dew Points for each forecast hour averaged over the 28 days. Can anyone see any bias??
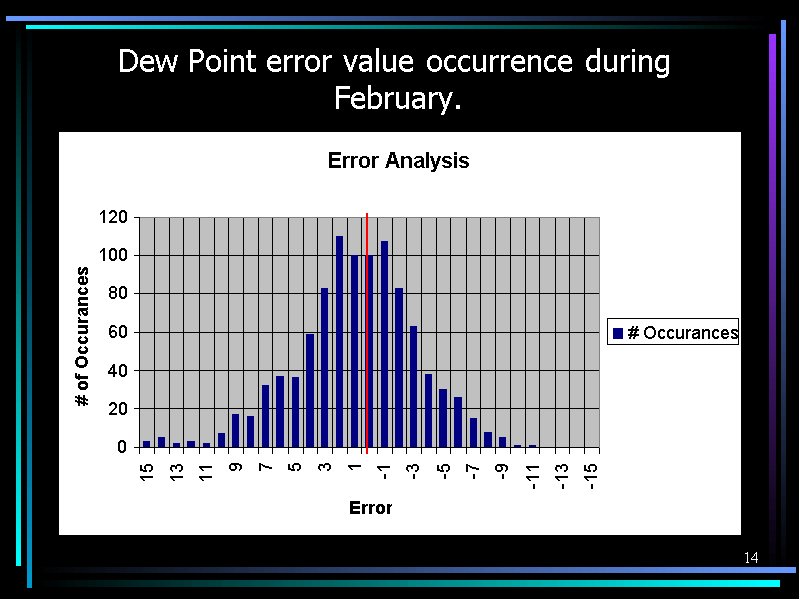
- Dew Point error value occurrence during February.
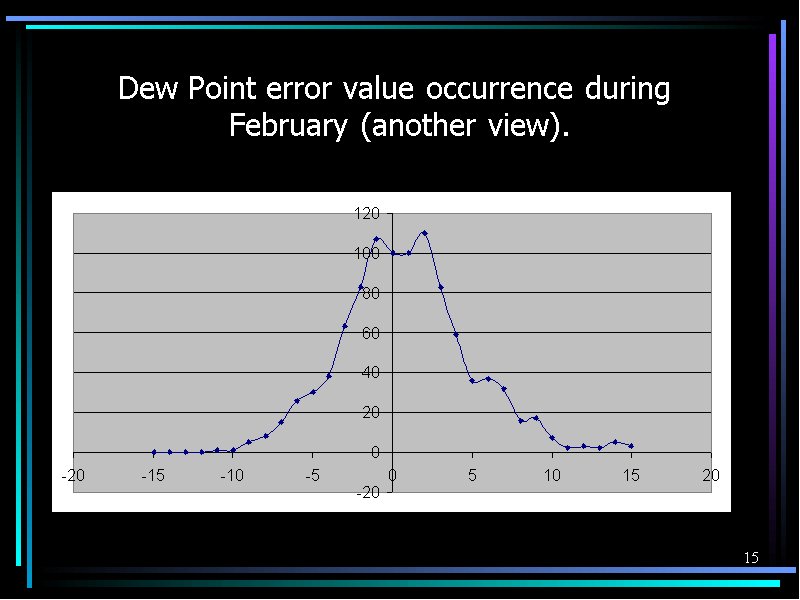
- Dew Point error value occurrence during February (another view).
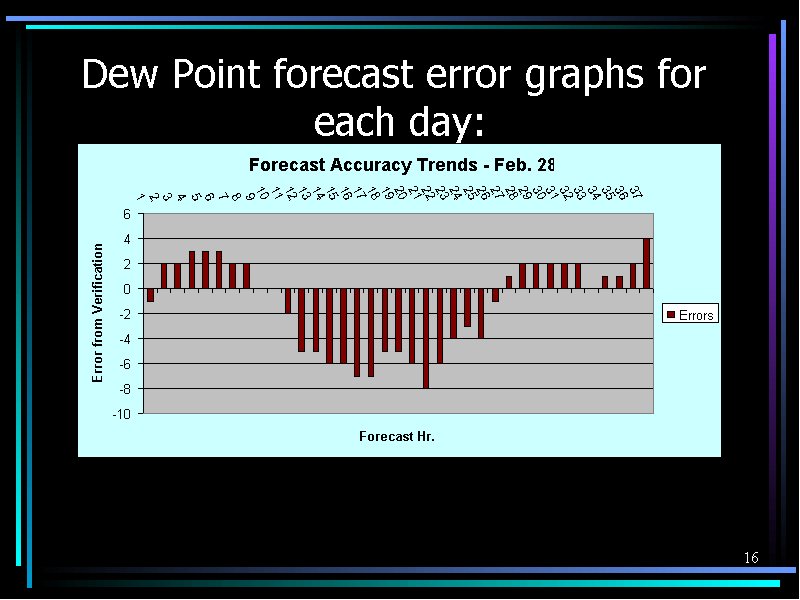
- Dew Point forecast error graphs for each day:
- Slide 17
- Slide 18
- Conclusions:
- Further Research:
- Further Research:
- Slide 22
|