| A | B | C | D | E | F | G | H | I | J | |
|---|---|---|---|---|---|---|---|---|---|---|
| 1 |
|
|||||||||
| 2 | ||||||||||
| 3 | ||||||||||
| 4 | ||||||||||
| 5 | ||||||||||
| 6 | ||||||||||
| 7 | ||||||||||
| 8 | ||||||||||
| 9 | ||||||||||
| 10 | ||||||||||
| 11 | ||||||||||
| 12 | ||||||||||
| 13 | ||||||||||
| 14 | ||||||||||
| 15 | ||||||||||
| 16 | ||||||||||
| 17 | ||||||||||
| 18 | ||||||||||
| 19 | ||||||||||
| 20 | ||||||||||
| 21 | ||||||||||
| 22 | ||||||||||
| 23 | ||||||||||
| 24 | ||||||||||
| 25 | ||||||||||
| 26 | ||||||||||
| 27 | ||||||||||
| 28 | ||||||||||
| 29 | ||||||||||
| 30 | ||||||||||
| A | B | C | D | E | F | G | H | I | J | |
|---|---|---|---|---|---|---|---|---|---|---|
| 1 |

|
|||||||||
| 2 | ||||||||||
| 3 | ||||||||||
| 4 | ||||||||||
| 5 | ||||||||||
| 6 | ||||||||||
| 7 | ||||||||||
| 8 | ||||||||||
| 9 | ||||||||||
| 10 | ||||||||||
| 11 | ||||||||||
| 12 | ||||||||||
| 13 | ||||||||||
| 14 | ||||||||||
| 15 | ||||||||||
| 16 | ||||||||||
| 17 | ||||||||||
| 18 | ||||||||||
| 19 | ||||||||||
| 20 | ||||||||||
| 21 | ||||||||||
| 22 | ||||||||||
| 23 | ||||||||||
| 24 | ||||||||||
| 25 | ||||||||||
| 26 | ||||||||||
| 27 | ||||||||||
| 28 | ||||||||||
| 29 | ||||||||||
| 30 | ||||||||||
| A | B | C | D | E | F | G | H | I | J | |
|---|---|---|---|---|---|---|---|---|---|---|
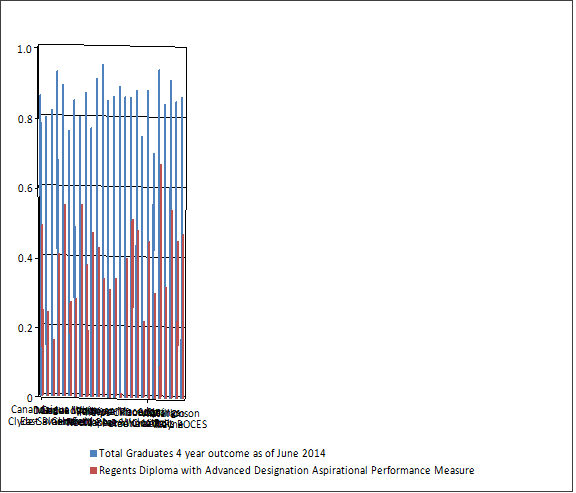
| 1 | DISTRICT_NAME | MEMBERSHIP_DESC | CohortEnroll | Graduates | RegentsAdvancedDesignation | Total Graduates 4 year outcome as of June 2014 | Regents Diploma with Advanced Designation Aspirational Performance Measure | RegentsDiploma% | LocalDiploma% | Regents and Local |
| 2 | Canandaigua | 2010 Total Cohort - 4 Year Outcome | 322 | 277 | 157 | 86% | 49% | 34% | 4% | 38% |
| 3 | Clyde-Savannah | 2010 Total Cohort - 4 Year Outcome | 66 | 53 | 16 | 80% | 24% | 47% | 9% | 56% |
| 4 | Dundee | 2010 Total Cohort - 4 Year Outcome | 62 | 51 | 10 | 82% | 16% | 55% | 11% | 66% |
| 5 | East Bloomfield | 2010 Total Cohort - 4 Year Outcome | 86 | 80 | 35 | 93% | 41% | 44% | 8% | 52% |
| 6 | Gananda | 2010 Total Cohort - 4 Year Outcome | 96 | 85 | 53 | 89% | 55% | 29% | 4% | 33% |
| 7 | Geneva | 2010 Total Cohort - 4 Year Outcome | 174 | 133 | 47 | 76% | 27% | 41% | 9% | 50% |
| 8 | Marcus Whitman | 2010 Total Cohort - 4 Year Outcome | 107 | 91 | 30 | 85% | 28% | 54% | 3% | 57% |
| 9 | Honeoye | 2010 Total Cohort - 4 Year Outcome | 55 | 44 | 30 | 80% | 55% | 20% | 5% | 25% |
| 10 | Lyons | 2010 Total Cohort - 4 Year Outcome | 71 | 62 | 27 | 87% | 38% | 34% | 15% | 49% |
| 11 | Red Jacket | 2010 Total Cohort - 4 Year Outcome | 62 | 48 | 29 | 77% | 47% | 27% | 3% | 30% |
| 12 | Marion | 2010 Total Cohort - 4 Year Outcome | 69 | 63 | 30 | 91% | 43% | 43% | 4% | 47% |
| 13 | Naples | 2010 Total Cohort - 4 Year Outcome | 74 | 70 | 25 | 95% | 34% | 49% | 12% | 61% |
| 14 | Newark | 2010 Total Cohort - 4 Year Outcome | 167 | 142 | 51 | 85% | 31% | 50% | 4% | 54% |
| 15 | North Rose-Wolcott | 2010 Total Cohort - 4 Year Outcome | 106 | 91 | 36 | 86% | 34% | 43% | 8% | 51% |
| 16 | Palmyra-Macedon | 2010 Total Cohort - 4 Year Outcome | 167 | 148 | 1 | 89% | 1% | 88% | 0% | 88% |
| 17 | Penn Yan | 2010 Total Cohort - 4 Year Outcome | 137 | 118 | 55 | 86% | 40% | 41% | 5% | 46% |
| 18 | Phelps-Clifton Springs | 2010 Total Cohort - 4 Year Outcome | 138 | 118 | 70 | 86% | 51% | 30% | 5% | 35% |
| 19 | Red Creek | 2010 Total Cohort - 4 Year Outcome | 73 | 64 | 35 | 88% | 48% | 37% | 3% | 40% |
| 20 | Romulus | 2010 Total Cohort - 4 Year Outcome | 32 | 24 | 7 | 75% | 22% | 53% | 0% | 53% |
| 21 | Seneca Falls | 2010 Total Cohort - 4 Year Outcome | 99 | 87 | 45 | 88% | 45% | 34% | 8% | 42% |
| 22 | Sodus | 2010 Total Cohort - 4 Year Outcome | 88 | 62 | 26 | 70% | 30% | 40% | 1% | 41% |
| 23 | Victor | 2010 Total Cohort - 4 Year Outcome | 314 | 294 | 210 | 94% | 67% | 24% | 3% | 27% |
| 24 | Waterloo | 2010 Total Cohort - 4 Year Outcome | 158 | 133 | 51 | 84% | 32% | 44% | 8% | 52% |
| 25 | Wayne | 2010 Total Cohort - 4 Year Outcome | 211 | 192 | 113 | 91% | 54% | 35% | 2% | 37% |
| 26 | Williamson | 2010 Total Cohort - 4 Year Outcome | 88 | 75 | 40 | 85% | 45% | 31% | 9% | 40% |
| 27 | WFL BOCES | 3022 | 2605 | 1229 | 86% | 47% |
| A | B | C | D | E | F | G | H | I | |
|---|---|---|---|---|---|---|---|---|---|
| 1 | DISTRICT_NAME | MEMBERSHIP_DESC | CohortEnroll | Graduates | RegentsAdvancedDesignation | Total Graduates 4 year outcome as of August 2014 | Regents Diploma with Advanced Designation Aspirational Performance Measure | RegentsDiploma% | LocalDiploma% |
| 2 | Canandaigua | 2010 Total Cohort - 4 Year Outcome - August 2014 | 322 | 281 | 158 | 87% | 49% | 34% | 4% |
| 3 | Clyde-Savannah | 2010 Total Cohort - 4 Year Outcome - August 2014 | 66 | 53 | 16 | 80% | 24% | 47% | 9% |
| 4 | Dundee | 2010 Total Cohort - 4 Year Outcome - August 2014 | 62 | 51 | 10 | 82% | 16% | 55% | 11% |
| 5 | East Bloomfield | 2010 Total Cohort - 4 Year Outcome - August 2014 | 86 | 80 | 35 | 93% | 41% | 44% | 8% |
| 6 | Gananda | 2010 Total Cohort - 4 Year Outcome - August 2014 | 96 | 86 | 53 | 90% | 55% | 30% | 4% |
| 7 | Geneva | 2010 Total Cohort - 4 Year Outcome - August 2014 | 174 | 139 | 48 | 80% | 28% | 43% | 9% |
| 8 | Marcus Whitman | 2010 Total Cohort - 4 Year Outcome - August 2014 | 107 | 92 | 30 | 86% | 28% | 54% | 4% |
| 9 | Honeoye | 2010 Total Cohort - 4 Year Outcome - August 2014 | 55 | 46 | 32 | 84% | 58% | 20% | 5% |
| 10 | Lyons | 2010 Total Cohort - 4 Year Outcome - August 2014 | 71 | 62 | 27 | 87% | 38% | 34% | 15% |
| 11 | Red Jacket | 2010 Total Cohort - 4 Year Outcome - August 2014 | 62 | 48 | 29 | 77% | 47% | 27% | 3% |
| 12 | Marion | 2010 Total Cohort - 4 Year Outcome - August 2014 | 69 | 63 | 30 | 91% | 43% | 43% | 4% |
| 13 | Naples | 2010 Total Cohort - 4 Year Outcome - August 2014 | 74 | 70 | 25 | 95% | 34% | 49% | 12% |
| 14 | Newark | 2010 Total Cohort - 4 Year Outcome - August 2014 | 167 | 145 | 51 | 87% | 31% | 52% | 4% |
| 15 | North Rose-Wolcott | 2010 Total Cohort - 4 Year Outcome - August 2014 | 106 | 91 | 36 | 86% | 34% | 43% | 8% |
| 16 | Palmyra-Macedon | 2010 Total Cohort - 4 Year Outcome - August 2014 | 167 | 149 | 1 | 89% | 1% | 88% | 1% |
| 17 | Penn Yan | 2010 Total Cohort - 4 Year Outcome - August 2014 | 137 | 119 | 55 | 87% | 40% | 42% | 5% |
| 18 | Phelps-Clifton Springs | 2010 Total Cohort - 4 Year Outcome - August 2014 | 138 | 118 | 70 | 86% | 51% | 30% | 5% |
| 19 | Red Creek | 2010 Total Cohort - 4 Year Outcome - August 2014 | 73 | 64 | 35 | 88% | 48% | 37% | 3% |
| 20 | Romulus | 2010 Total Cohort - 4 Year Outcome - August 2014 | 32 | 24 | 7 | 75% | 22% | 53% | 0% |
| 21 | Seneca Falls | 2010 Total Cohort - 4 Year Outcome - August 2014 | 99 | 87 | 45 | 88% | 45% | 34% | 8% |
| 22 | Sodus | 2010 Total Cohort - 4 Year Outcome - August 2014 | 88 | 65 | 26 | 74% | 30% | 43% | 1% |
| 23 | Victor | 2010 Total Cohort - 4 Year Outcome - August 2014 | 314 | 295 | 210 | 94% | 67% | 24% | 3% |
| 24 | Waterloo | 2010 Total Cohort - 4 Year Outcome - August 2014 | 158 | 134 | 51 | 85% | 32% | 45% | 8% |
| 25 | Wayne | 2010 Total Cohort - 4 Year Outcome - August 2014 | 211 | 193 | 113 | 91% | 54% | 36% | 2% |
| 26 | Williamson | 2010 Total Cohort - 4 Year Outcome - August 2014 | 88 | 77 | 41 | 88% | 47% | 32% | 9% |
| 27 | WFL BOCES | 3022 | 2632 | 1234 | 87% | 41% |