| |
A |
B |
C |
D |
E |
F |
G |
H |
I |
J |
K |
L |
M |
N |
O |
P |
Q |
R |
S |
T |
U |
V |
W |
X |
Y |
Z |
AA |
AB |
| 1 |
|
|
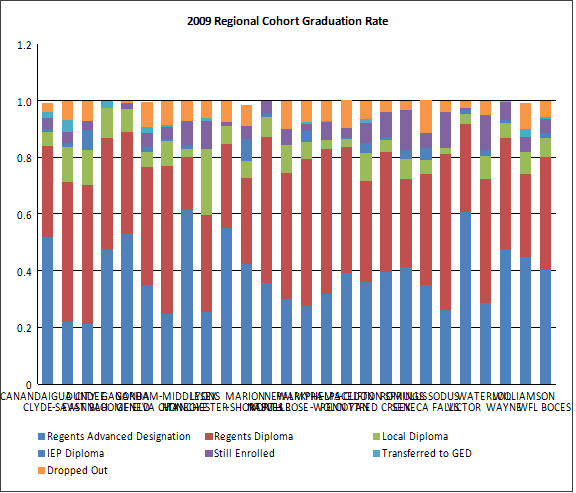
2009 Regional Cohort Graduation Rate & Enrollment Outcomes Summary
as of August 2013 |
|
|
|
|
|
|
|
|
|
|
|
|
|
|
|
|
|
|
|
|
|
|
|
|
|
| 2 |
Aggregation1 |
AggrCode |
District Report All Students |
DistrictCode |
DISTRICT_NAME |
REPORT_SCHOOL_YEAR |
MEMBERSHIP_DESC |
MEMBERSHIP_KEY |
ENROLL_OUTCOME |
SUBGROUP_CODE |
SUBGROUP_NAME |
2009 Cohort Members |
Total Graduates |
|
Regents Advanced Designation |
|
Regents Diploma |
|
Local Diploma |
|
IEP Diploma |
|
Still Enrolled |
|
Transferred to GED |
|
Dropped Out |
|
| 3 |
|
|
|
|
|
|
|
|
|
|
|
Count |
Count |
Percent |
Count |
Percent |
Count |
Percent |
Count |
Percent |
Count |
Percent |
Count |
Percent |
Count |
Percent |
Count |
Percent |
| 4 |
District |
430300050000 |
CANANDAIGUA CITY |
430300050000 |
CANANDAIGUA |
2012-13 |
2009 Total Cohort - 4 Year Outcome - August 2013 |
66 |
1 Day |
01 |
All Students |
323 |
287 |
89% |
167 |
52% |
104 |
32% |
16 |
5% |
4 |
1% |
12 |
4% |
7 |
2% |
10 |
3% |
| 5 |
District |
650301040000 |
CLYDE-SAVANNAH |
650301040000 |
CLYDE-SAVANNAH |
2012-13 |
2009 Total Cohort - 4 Year Outcome - August 2013 |
66 |
1 Day |
01 |
All Students |
73 |
61 |
84% |
16 |
22% |
36 |
49% |
9 |
12% |
1 |
1% |
3 |
4% |
3 |
4% |
5 |
7% |
| 6 |
District |
680801040000 |
DUNDEE |
680801040000 |
DUNDEE |
2012-13 |
2009 Total Cohort - 4 Year Outcome - August 2013 |
66 |
1 Day |
01 |
All Students |
57 |
47 |
83% |
12 |
21% |
28 |
49% |
7 |
12% |
4 |
7% |
2 |
4% |
0 |
0% |
4 |
7% |
| 7 |
District |
430501040000 |
EAST BLOOMFIELD |
430501040000 |
EAST BLOOMFIELD |
2012-13 |
2009 Total Cohort - 4 Year Outcome - August 2013 |
66 |
1 Day |
01 |
All Students |
76 |
74 |
97% |
36 |
47% |
30 |
40% |
8 |
11% |
0 |
0% |
0 |
0% |
2 |
3% |
0 |
0% |
| 8 |
District |
650902040000 |
GANANDA |
650902040000 |
GANANDA |
2012-13 |
2009 Total Cohort - 4 Year Outcome - August 2013 |
66 |
1 Day |
01 |
All Students |
98 |
95 |
97% |
52 |
53% |
35 |
36% |
8 |
8% |
0 |
0% |
2 |
2% |
0 |
0% |
1 |
1% |
| 9 |
District |
430700010000 |
GENEVA CITY |
430700010000 |
GENEVA |
2012-13 |
2009 Total Cohort - 4 Year Outcome - August 2013 |
66 |
1 Day |
01 |
All Students |
208 |
170 |
82% |
73 |
35% |
86 |
41% |
11 |
5% |
4 |
2% |
10 |
5% |
5 |
2% |
18 |
9% |
| 10 |
District |
430901060000 |
GORHAM-MIDDLESEX |
430901060000 |
GORHAM-MIDDLESEX |
2012-13 |
2009 Total Cohort - 4 Year Outcome - August 2013 |
66 |
1 Day |
01 |
All Students |
118 |
101 |
86% |
29 |
25% |
62 |
53% |
10 |
9% |
1 |
1% |
5 |
4% |
1 |
1% |
10 |
9% |
| 11 |
District |
431401040000 |
HONEOYE |
431401040000 |
HONEOYE |
2012-13 |
2009 Total Cohort - 4 Year Outcome - August 2013 |
66 |
1 Day |
01 |
All Students |
70 |
58 |
83% |
43 |
61% |
13 |
19% |
2 |
3% |
1 |
1% |
6 |
9% |
0 |
0% |
5 |
7% |
| 12 |
District |
650501040000 |
LYONS |
650501040000 |
LYONS |
2012-13 |
2009 Total Cohort - 4 Year Outcome - August 2013 |
66 |
1 Day |
01 |
All Students |
82 |
68 |
83% |
21 |
26% |
28 |
34% |
19 |
23% |
0 |
0% |
8 |
10% |
1 |
1% |
5 |
6% |
| 13 |
District |
431101040000 |
MANCHESTER-SHORTSVILLE |
431101040000 |
MANCHSTR-SHRTSVLLE |
2012-13 |
2009 Total Cohort - 4 Year Outcome - August 2013 |
66 |
1 Day |
01 |
All Students |
78 |
71 |
91% |
43 |
55% |
23 |
30% |
5 |
6% |
0 |
0% |
1 |
1% |
0 |
0% |
6 |
8% |
| 14 |
District |
650701040000 |
MARION |
650701040000 |
MARION |
2012-13 |
2009 Total Cohort - 4 Year Outcome - August 2013 |
66 |
1 Day |
01 |
All Students |
66 |
52 |
79% |
28 |
42% |
20 |
30% |
4 |
6% |
5 |
8% |
3 |
5% |
0 |
0% |
5 |
8% |
| 15 |
District |
431201040000 |
NAPLES |
431201040000 |
NAPLES |
2012-13 |
2009 Total Cohort - 4 Year Outcome - August 2013 |
66 |
1 Day |
01 |
All Students |
70 |
66 |
94% |
25 |
36% |
36 |
51% |
5 |
7% |
1 |
1% |
3 |
4% |
0 |
0% |
0 |
0% |
| 16 |
District |
650101060000 |
NEWARK |
650101060000 |
NEWARK |
2012-13 |
2009 Total Cohort - 4 Year Outcome - August 2013 |
66 |
1 Day |
01 |
All Students |
172 |
145 |
84% |
52 |
30% |
76 |
44% |
17 |
10% |
0 |
0% |
10 |
6% |
0 |
0% |
17 |
10% |
| 17 |
District |
651501060000 |
NORTH ROSE-WOLCOTT |
651501060000 |
NORTH ROSE WOLCOTT |
2012-13 |
2009 Total Cohort - 4 Year Outcome - August 2013 |
66 |
1 Day |
01 |
All Students |
131 |
112 |
86% |
36 |
28% |
68 |
52% |
8 |
6% |
5 |
4% |
3 |
2% |
1 |
1% |
10 |
8% |
| 18 |
District |
650901060000 |
PALMYRA-MACEDON |
650901060000 |
PALMYRA-MACEDON |
2012-13 |
2009 Total Cohort - 4 Year Outcome - August 2013 |
66 |
1 Day |
01 |
All Students |
158 |
136 |
86% |
50 |
32% |
81 |
51% |
5 |
3% |
0 |
0% |
10 |
6% |
1 |
1% |
11 |
7% |
| 19 |
District |
680601060000 |
PENN YAN |
680601060000 |
PENN YAN |
2012-13 |
2009 Total Cohort - 4 Year Outcome - August 2013 |
66 |
1 Day |
01 |
All Students |
133 |
115 |
87% |
52 |
39% |
59 |
44% |
4 |
3% |
1 |
1% |
4 |
3% |
0 |
0% |
13 |
10% |
| 20 |
District |
431301060000 |
PHELPS-CLIFTON SPRINGS |
431301060000 |
PHELPS-CLIFTON SPR |
2012-13 |
2009 Total Cohort - 4 Year Outcome - August 2013 |
66 |
1 Day |
01 |
All Students |
153 |
125 |
82% |
55 |
36% |
55 |
36% |
15 |
10% |
5 |
3% |
11 |
7% |
2 |
1% |
10 |
7% |
| 21 |
District |
651503040000 |
RED CREEK |
651503040000 |
RED CREEK |
2012-13 |
2009 Total Cohort - 4 Year Outcome - August 2013 |
66 |
1 Day |
01 |
All Students |
71 |
61 |
86% |
28 |
39% |
30 |
42% |
3 |
4% |
1 |
1% |
6 |
9% |
0 |
0% |
3 |
4% |
| 22 |
District |
560603040000 |
ROMULUS |
560603040000 |
ROMULUS |
2012-13 |
2009 Total Cohort - 4 Year Outcome - August 2013 |
66 |
1 Day |
01 |
All Students |
29 |
23 |
79% |
12 |
41% |
9 |
31% |
2 |
7% |
1 |
3% |
4 |
14% |
0 |
0% |
1 |
3% |
| 23 |
District |
560701060000 |
SENECA FALLS |
560701060000 |
SENECA FALLS |
2012-13 |
2009 Total Cohort - 4 Year Outcome - August 2013 |
66 |
1 Day |
01 |
All Students |
120 |
95 |
79% |
42 |
35% |
47 |
39% |
6 |
5% |
5 |
4% |
6 |
5% |
0 |
0% |
14 |
12% |
| 24 |
District |
651201060000 |
SODUS |
651201060000 |
SODUS |
2012-13 |
2009 Total Cohort - 4 Year Outcome - August 2013 |
66 |
1 Day |
01 |
All Students |
96 |
80 |
83% |
25 |
26% |
53 |
55% |
2 |
2% |
0 |
0% |
12 |
13% |
0 |
0% |
4 |
4% |
| 25 |
District |
431701060000 |
VICTOR |
431701060000 |
VICTOR |
2012-13 |
2009 Total Cohort - 4 Year Outcome - August 2013 |
66 |
1 Day |
01 |
All Students |
347 |
331 |
95% |
211 |
61% |
107 |
31% |
13 |
4% |
4 |
1% |
3 |
1% |
0 |
0% |
8 |
2% |
| 26 |
District |
561006060000 |
WATERLOO |
561006060000 |
WATERLOO |
2012-13 |
2009 Total Cohort - 4 Year Outcome - August 2013 |
66 |
1 Day |
01 |
All Students |
137 |
110 |
80% |
39 |
28% |
60 |
44% |
11 |
8% |
3 |
2% |
17 |
12% |
0 |
0% |
7 |
5% |
| 27 |
District |
650801060000 |
WAYNE |
650801060000 |
WAYNE |
2012-13 |
2009 Total Cohort - 4 Year Outcome - August 2013 |
66 |
1 Day |
01 |
All Students |
206 |
190 |
92% |
98 |
48% |
81 |
39% |
11 |
5% |
2 |
1% |
13 |
6% |
0 |
0% |
1 |
1% |
| 28 |
District |
651402040000 |
WILLIAMSON |
651402040000 |
WILLIAMSON |
2012-13 |
2009 Total Cohort - 4 Year Outcome - August 2013 |
66 |
1 Day |
01 |
All Students |
100 |
82 |
82% |
45 |
45% |
29 |
29% |
8 |
8% |
0 |
0% |
5 |
5% |
3 |
3% |
9 |
9% |
| 29 |
|
|
|
|
|
|
|
|
|
|
|
|
|
|
|
|
|
|
|
|
|
|
|
|
|
|
|
|
| 30 |
|
|
WFL BOCES |
|
|
|
|
|
|
|
|
3172 |
2755 |
87% |
1290 |
41% |
1256 |
40% |
209 |
7% |
48 |
2% |
159 |
5% |
26 |
1% |
177 |
6% |