Latest revision
8/13/01
©1997-2001 Regents of the University of California
Table of Contents
Resource Kit
Getting Started
Data Manager
Getting Started
Starting a Project
Using Variables
Importing Data
Using Groups
Database View
Working with Goals
Reports View
Exporting Data
Appendices
I: Optimizing Your Data
II: Technical Information
1
7
11
15
23
29
35
41
47
99
103
107
The QSP
Resource Kit
Getting
Started
Background
The QSP Resource Kit is a collection of instruments (surveys,
targeted questionnaires, interview and observation protocols)
that can help gather data about a school’s overall climate and
instructional practices. These instruments were originally
used in different contexts and programs, but they can be
customized to fit your situation with a few minor adjustments.
How do I
get started?
You will need to be sure that
Acrobat Reader
TM
is installed
on your computer. If it is not, locate the install file
RS405ENG.EXE,
included on your CD-ROM. Double-click
this file and follow the instructions on the installer.
To open the Resource Kit, double-click on the
QSP Resource
Kit
icon. You will first get the
Home Menu
(see pg 2) for
the Resource Kit. Moving the mouse cursor over an image
displays the title of that resource section.
General Information
1
The sections and corresponding color codes are as follows:
Safety & Security
blue
Parental Involvement
green
Technology & Innovation
yellow
Special Programs
orange
Curriculum & Instruction
red
Professional Development
purple
How do I
choose an instrument?
Decide what section you are interested in and click on the
appropriate image. This will take you to the
Available
Instruments
screen for that section. On this screen, you will
see a list of instruments (or measures) to choose from. If you
want to explore a different section, click the
home
button to
return to the Home Menu. Otherwise, click on the instrument
about which you would like more information. This will take
you to the instrument’s
Navigation Menu
.
2
QSP User Guide
The Home Menu
How do I use
the Navigation Menu?
The active area of the Navigation Menu consists of four
covered buttons. Moving the mouse cursor over a button
uncovers the button and shows its title flag.
Home
Click to leave this section
and return to the Home Menu.
Back
Click to leave this instrument and return to the
Available Instruments screen for this section.
Instrument Details
Click to bring up more information
about the instrument.
View Instrument
Click to bring up two options for viewing:
To open the instrument in Acrobat Reader
TM
, click
on the upper box. To open the instrument in rich text
format in Microsoft Word
®
, choose the lower box.
What can I do
in Acrobat Reader?
Once the instrument is open, read it over to see if it is exactly
what you want. Acrobat’s navigation tools will help you get
around (see page 4).
General Information
3
4
QSP User Guide
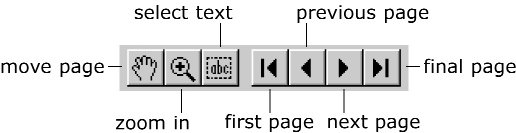
Navigation tools
in Acrobat Reader
If you decide to use the instrument as is, simply select
Print
from the
File
menu. The instrument will print exactly as
you see it on screen. However, if you want to customize the
instrument to your particular needs, you’ll need to open it
in
rich text format
in Word.
What can I do
in Microsoft Word?
Once the instrument is open in Word, its entire text is fully
editable for customization. However, we ask that you refrain
from making significant changes (such as removing large
sections of the survey) unless you have prior experience
developing measures. The intent is for you to change the
headings or titles to match your school or project name.
Back to top
The QSP
Data Manager
Getting
Started
Installing the Data Manager
Put in the QSP CD into the CD-ROM drive of your computer.
The main installer dialog box will appear. Click on the
Install
Data Manager
button. When you see the
InstallSheild Wizard
screen, click
Next
to continue. You will then see another dia-
log explaining that the Wizard will install QSP on your com-
puter. Click
Next
to continue. You will see the
Non-Disclosure
screen (see pg 8).
Getting Started
7
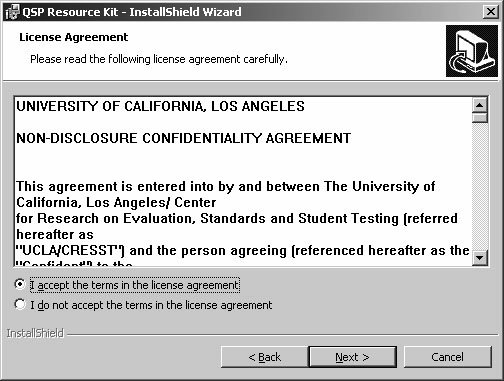
If you agree with the license agreement, then click
I accept the
terms of the license agreement
, and click
Next
to continue.
You will now see the
Destination Folder
screen (see pg 9).
Here, you need to choose a directory for QSP. Decide where
you want to install QSP on your computer, and click
Next
to
continue.
Finally, you will see a screen telling you that the installation of
QSP has been completed. Click finish to exit the Wizard.
8
QSP User Guide
The
Non-Disclosure
screen
Starting the Data Manager
The Data Manager can be started by double-clicking the QSP
Data Manager icon in the QSP folder in the Windows file
menu, or by selecting Data Manager from the choices present-
ed on the CD autorun menu screen.
Before any data can be accessed, however, you must first
create a new Project for yourself.
Getting Started
9
The Destination
Folder screen
10
QSP User Guide
Starting
a Project
Background
The Data Manager stores its information in the form of
Projects, which you define. Each Project has its own unique
password and can contain anything from a few students’
information to your entire school’s data. To create a new
Project, you must have a user profile. Your profile stores
information about you, your school, and allows future back-
door access to the database if you forget your password.
How do I create a User Profile?
When you first open QSP, you are prompted to choose a
Project to open. Instead, click the
New
button. In the
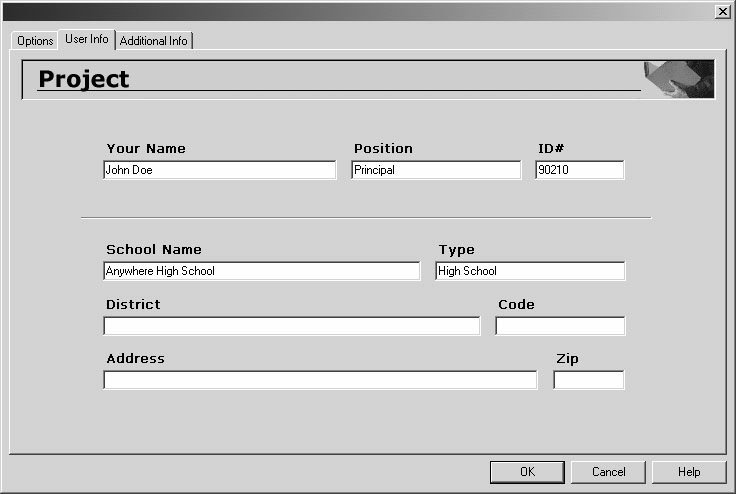
User
Info
screen (see pg 12), type in the appropriate information:
Your Name:
First and last name, separated by a space
Position:
Principal, administrator, etc.
ID#:
Your employee identification number
School Name:
The full name of your school
Type:
Magnet, charter, etc.
District:
The name of your school district
Code:
The code for your school (if one exists)
Address:
The street address of your school
Zip:
The zip code for your school
Starting a Project
11
Once you have entered all the fields, click
OK.
You will then
see a dialog box which asks you to title your QSP Project.
Type in a descriptive name depending on how you decide to
divide up your school either into several smaller datasets or
one large dataset. For example, if you decide to keep a differ-
ent project for each grade level, use a name like
1998 Grade 9,
1998 Grade 10,
etc. If you have just one project for the whole
school, use a name like
King Jr High.
Click
OK
to confirm.
The next dialog box will ask you to enter a password twice
(note that the actual letters you type in will appear as aster-
isks, and remember that passwords are case sensitive). The
password must have a minimum of eight characters. Click
OK
again. You will get a dialog box which displays
Current
Data
of what you entered in the User Info screen. Verify the
information in the box and then click
OK
to continue. QSP
will now open an empty database file with your Project name
ready for data to be imported into it.
If you would like to view the sample Project, the password is
eight ones, or “11111111.”
12
QSP User Guide
The User Info
Screen
How can I edit my Projects?
Once you have created a Project file, you can access your
Project Information by clicking on the Project button (see pg
91) or by selecting
Project Info
from the
Edit
menu. You will
be presented with the Project View, consisting of three Tabs, or
pages. The
User Info
Tab contains all the information you
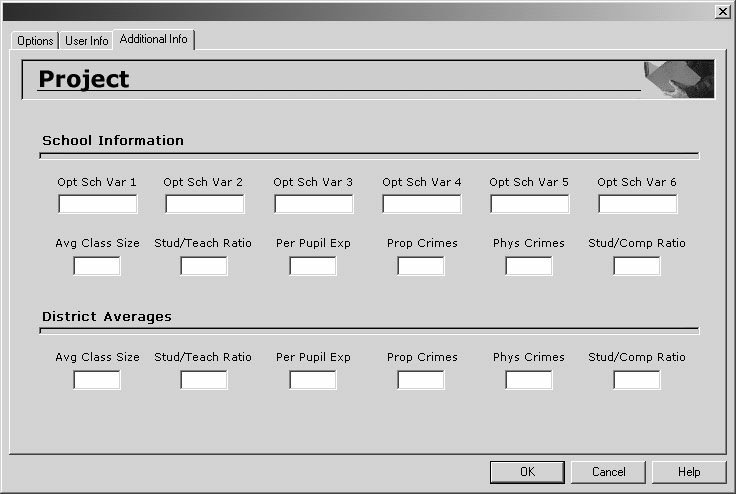
entered initially. The
Additional Information
Tab contains six
Variables for both school-level and district-level data. Simply
enter the values for your school and district. You can also
enter up to six optional school Variables whose names you
can change by clicking the
Edit Additional Info Variable
Names
button on the
Options
Tab (see pg 14). This takes you
to an edit dialog with two boxes:
Current Name
and
New
Name
. Click on the arrow below
Current Name,
scroll down to
the Variable you want to change, and click on it. Then, click
inside the
New Name
box and type in the new name you
would like. When you click
OK
, you will notice that the
Variable names you changed now appear on the
Additional
Information
Tab and you can enter the values that correspond
Starting a Project
13
The Additional
Information Tab
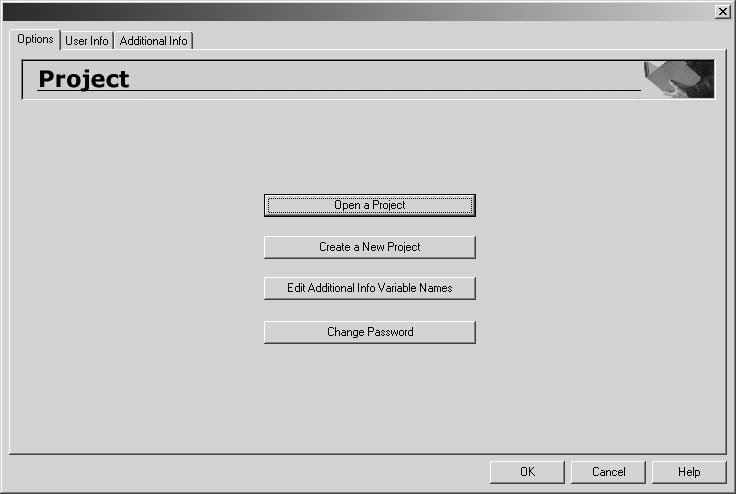
to that information. The
Options
Tab also contains three more
buttons. Clicking on
Open a Project
allows you to save your
current Project and open another one.
Create a New Project
takes you through the same process of starting a Project, with
a new user profile, as discussed earlier. Lastly,
Change
Password
allows you to enter a new password for the current
Project, provided that you know the current password.
14
QSP User Guide
The Options Tab
Using
Variables
Background
Variables and Groups (see pg 29) comprise the two major
building blocks of QSP. Almost all your school’s informa-
tion contained in QSP is in the form of student Variables
(such as ethnicity, test scores, grade level, etc), which are
further broken down into Groups. There is a limit to the
number of Variables allowed in QSP. Currently, the pro-
gram supports 39 pre-built Variables of several Types and
108 optional Variables. .
How are Variables organized?
To understand the organization of Variables in QSP, first go
to the
Variables
dialog (see pg 16) by clicking on the tool-
bar’s
Variable
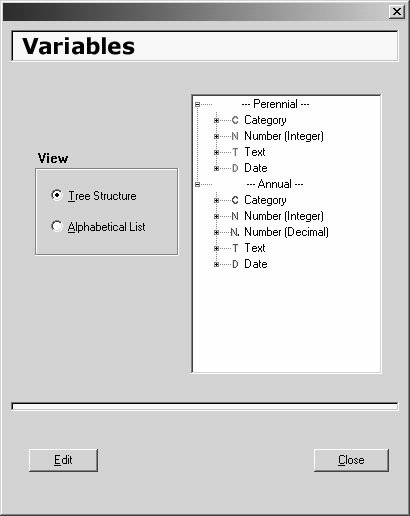
button (see Appx II). You will be presented
with a “tree” containing all of QSP’s Variables. The
orgaization of this tree is based on the organization of
Variables by
Type
. In the QSP Data Manager, Variables are
either
Perennial
or
Annual
, and belong to one of five Types:
Categorical, Numerical, Numeric Decimal, Text,
and
Date
.
Each Variable has a graphical icon associated with it to call
out its Type.
Using Variables
15
Variable Types and their icons
Notice that to the Variable tree is first broken up into two
parts: Perennial and Annual.
Perennial
Variables contain data which is
essentially unchang-
ing,
such as name, ethnicity, and zip code. Their icons are
always
green
.
Annual
Variables are designed to
change over time
such as
grade, language proficiency, test scores, etc. They are stored
from year to year, and their icons are always
blue
.
Both of the above options contain the same five Variable
Types, and thus have the same icons (except for their color):
16
QSP User Guide
The Variables
Dialog
Categorical
This Type is used for Variables (such as
Ethnicity
) that can be
broken down into
Groups
(such as
Black, Asian,
etc.) and then
used for disaggregation.
Numerical
This Type is used for Variables (such as student test scores)
which produce
whole number
results in all reporting and
calculations.
Numeric Decimal
This Type is used for Variables (such as grade point averages)
which produce
fractional number
results in all reporting and
calculations.
Text
This Variable Type is
informational
in nature and will not be
calculated or counted. This Variable can contain any kind of
information in most combinations and can be used to identify
specific students. Student street addresses and student ID
numbers are examples of this Type.
Date
QSP can support dates in these formats:
MM/DD/YY,
MM-DD-YY,
or MMDDYY
.
(Or
MDDYY
where the first
digit of month is assumed to be 0).
The icons associated with these Types are:
C = Categorical
N = Numerical
N. = Numeric Decimal
T = Text
D = Date
green = Perennial Variable
blue = Annual Variable
Using Variables
17
How do I edit a Categorical Variable?
Go to the
Edit
menu and select
Edit Variable,
or just click the
Variables
button. In the
Variables
dialog, you have two view-
ing options. Clicking on
Tree Structure
shows all the
Variables organized by Type. Clicking on
Alphabetical List
shows all the Variables in alphabetical order.
Note
Only Variables with active data have icons associated with them.
Unless you’re working with the Sample Project, your Variable list
might have no icons.
Highlight the Variable of interest and click
Edit.
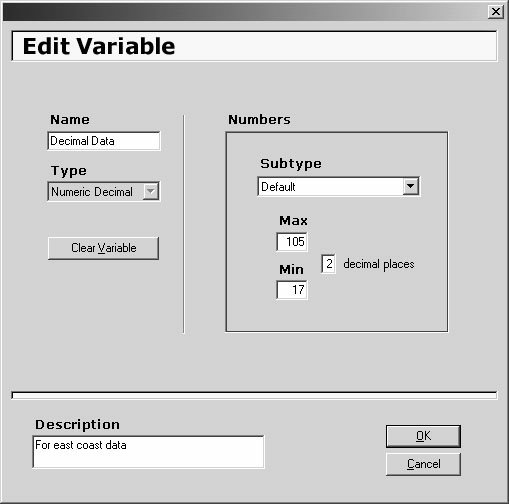
If you have
selected a Categorical Variable, then you will see the follow-
ing
Edit Variable
dialog:
Here, you can edit the
Name
of the Variable, add a brief
Description
of the Variable, or edit the Category list.
18
QSP User Guide
Edit Variable
Dialog
!
How do I edit the Category list?
In the
Categories
box, you will see three columns. The first
contains each Category’s
QSP Value
(its assigned number in
QSP)
.
The second holds each Category’s
File Value
(its name
in the original data file). The third contains each Category’s
Name
(its name in QSP).
To edit an existing Category, highlight the Category you wish
to edit in the
Categories
box and click
Edit.
In the
Edit
Category
dialog box, you can only edit the
Name,
not the
QSP
Value,
or
File Value.
Click
OK
to confirm.
To add a Category, simply click the
Add
button. Enter the
Name
,
QSP Value
, and
File Value
. Keep in mind that the QSP
Value should be a number not already used by another
Category. Click
OK
to confirm.
Merging Categories can be useful to simplify your database.
For instance, if you have very small numbers of Filipino,
Vietnamese, and Chinese students, it might be easier to create
a new
Asian
Category and merge them into it. To merge
Categories, click the
Merge
button to get the
Merge
dialog.
Select both the Category to be merged and the Category to
merge into. Click
OK
to confirm. The first Category will be
gone, and all of its data will be contained in the second.
Note
This process is irreversible, so only merge Categories when you
are certain you won’t need the original Category ever again. Also,
merging deletes the Group (see pg 29) associated with the original
Category, which could have effects in Reporting.
Using Variables
19
!
There are also two options for changing the display of the
Category list. Clicking the
Sort A-Z
button rearranges the list
so that it is presented alphabetically. Highlighting a Category
and clicking the up or down arrow next to
Change Order
moves that Category up or down the list. Keep in mind that
neither of these options changes the QSP Value or File Value
of the Category.
How do I edit a Numerical Variable?
In the
Variables
dialog, highlight the Variable of interest and
click
Edit.
If you have selected a Numerical Variable, then
you will see the following
Edit Variable
dialog:
Here, you can edit the
Name
of the Variable, add a brief
Description
of the Variable, or edit the information in the
Numbers
box.
20
QSP User Guide
Edit Variable
Dialog
By default, QSP scans the data in the Variable and inserts the
observed maximum and minimum values into the
Max
and
Min
boxes. You can change these numbers to increase or
decrease the range of valid data for that Variable. Also, (only
if you have selected a Numeric
Decimal
Variable) you can
change the number of decimal places to make QSP round off
any data beyond those places.
What are Subtypes?
In the
Numbers
box there is a pull-down list labeled
Subtype
.
Subtypes are designations to aid you in making Charts and
Reports with your data. When reporting, you should only
make comparisons using Variables that have relevance with
one another. Assigning Subtypes to your Variables allows
you to put them into logical groups for logical comparisons.
All of your Numerical Variables should have one of the
following Subtypes:
Stanine 1-9 NCE 10-999
Placement Test 1-6 Large Scale 101-2000
Percentile Rank 1-99 ACT 1-36
Percent 0-100 Default
All of your Numeric Decimal Variables should have one of
the following Subtypes:
Probability 0-1 GPA 1-5
Percent 0-100 Default
NCE 1-99
The numbers included in each name represent the Subtype’s
range. When you select a Subtype for a Variable, QSP auto-
Using Variables
21
matically inserts those numbers into that Variable’s Max and
Min boxes.
How do I edit a
Text or Date Variable?
In the
Variables
dialog, highlight the Variable of interest and
click
Edit.
For Text and Date Variables, you can only edit the
Name
and the
Description
of the Variable.
How do change
a Variable’s Type?
The only way to change a Variable’s Type is to clear the
Variable entirely, removing all data stored there. You can
only change the Type for Categorical, Numeric, and Numeric
Decimal Variables. (Text and Date Variables may be cleared,
but their Type cannot be changed.) In the
Variables
dialog,
highlight the Variable of interest and click
Edit.
In the
Edit
Variable
dialog, click the
Clear Variable
button. You will be
led through a series of confirmation dialogs warning you of
the consequences of your actions.
Note
Remember, this CANNOT BE UNDONE. All the data for that
Variable will be gone, all associated Groups will be deleted, and any
Charts that you have created with that Variable will be affected.
If you’re certain you want to continue, click
OK
to confirm.
The
Type
pulldown will become active, and you can select one
of the three Types listed. (You cannot, however, change a
Perennial Variable to an Annual, or vice versa). In the
Variables
dialog, notice that the icon associated with that
Variable has changed to reflect its new Type.
22
QSP User Guide
!
Importing
Data
Background
Of the 143 Variables in the Data Manager, most are optional
Variables, available for just about any data you would like.
However, 27 of these Variables are predesignated to provide
information used in compliance with Title I. We suggest
you import this data from a separate source. Either your
district or local data systems should be able to output the
Variables listed below:
Perennial Student Information
Student ID Date of Birth
Cohort Ethnicity
First Name Primary Language
Middle Name Home Zip Code
Last Name Home City
Gender
Annual Outcomes
NRT Math PBA Language Arts
NRT Language Arts PBA Math
Importing Data
23
Annual Student Information
School ID Language Proficiency
Years at Current School Disability Status
Grade Level Lunch Code
AFDC Recipient Special Ed.
Migratory Gifted
Bussed Attendance
Remember, different districts store data under different
names. For example, the Variable name
Ethnicity
would be
stored under the Variable name
Race
in some areas.
Primary
Language
has been stored as
Home Language
,
L1,
and a number
of other variations, but don’t worry. Later, during the import
process, you will be given the opportunity to map Variables
in the file you are importing to their corresponding places in
the Data Manager.
What do I need to know
about the file I’m importing?
You need to know several things about the file you import.
First off, you must have the necessary descriptions of the
Variables within the file. Often the data is accompanied by a
codebook or description sheet. If you do not know which
Variables are which, then it will be difficult to know what it is
you are importing.
24
QSP User Guide
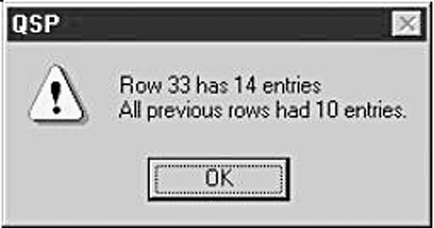
Note
Every file being imported
must have the student ID number as a
Variable in the file. QSP uses this number to determine what data
belongs with which record. Unless every record has a student ID
number, the program will halt execution. You should look at the file
in Excel or a similar program and remove the records that do not
have ID numbers. Make a note to yourself to locate the ID numbers
for the student records without one.
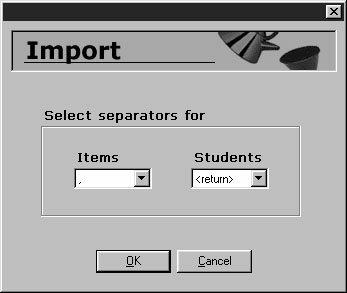
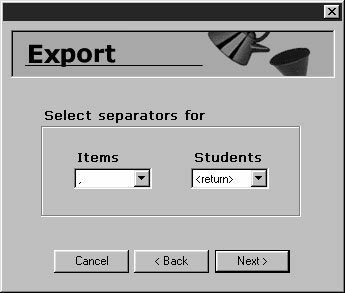
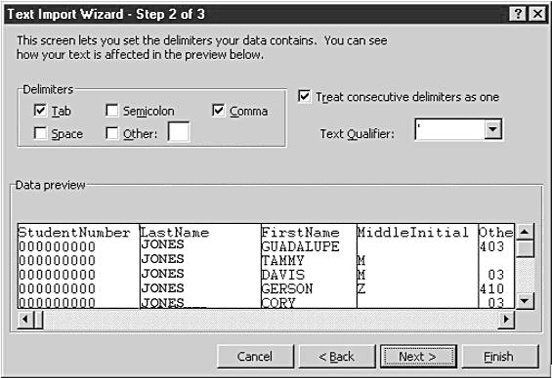
Next, you need to know what format the data is in. There are
two pieces of key information concerning this: the
Item
Separator
and the
Student Separator.
The QSP Data Manager
can import the data in many different separator combinations,
but you will need to tell the program which separators are in
the file that you are importing.
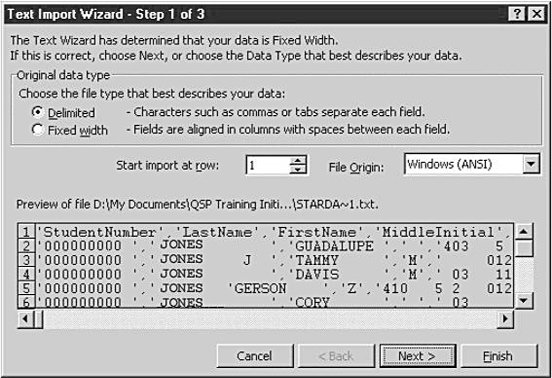
The last bit of information you will need is related to the type
of file being imported. The QSP Importer will prompt you for
the type of file you would like to bring in. The Importer can
read files of a number of different characteristics, but the file
must have of one of the following two extensions: a
text file
(*.txt),
a or a
comma-delimited file (*.csv).
Files without one of
these extensions will not be viewable using QSP. For more on
this, see Appendix I.
Importing Data
25
Text File
Separators
!
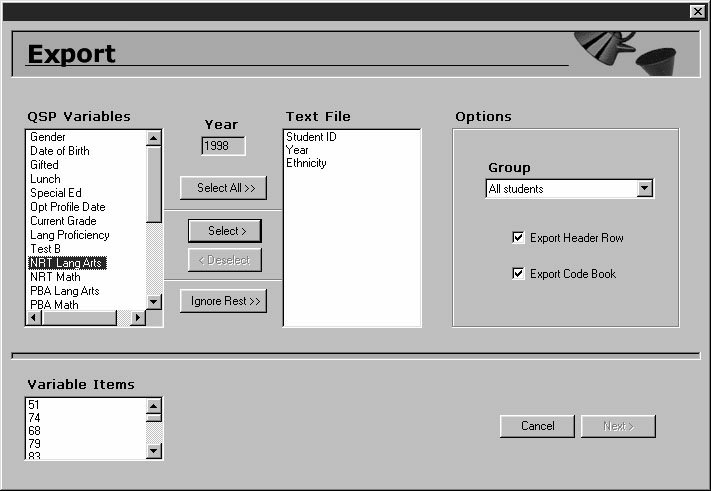
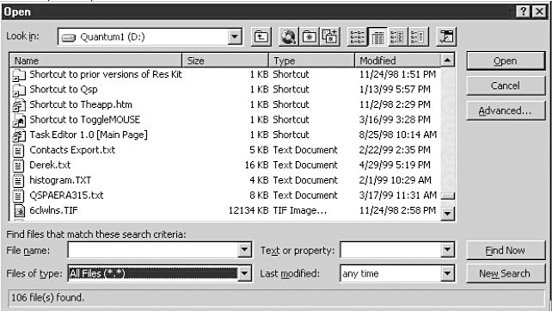
How do I import data
into the Data Manager?
Select the File
To begin the import process, select
Import
from the
File
menu
or click the
Import/Export
button (see Appx II). You will see
a dialog asking if you want to import or export your data.
Click the button next to
Import new data
, then
OK
. Select the
file that you want to import and click
Open.
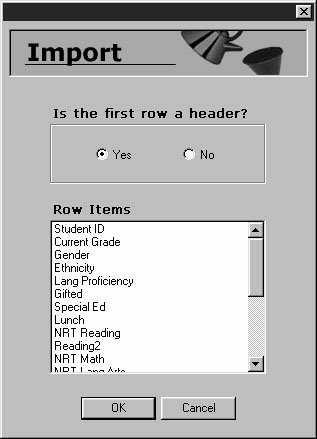
During the selec-
tion process, the Importer will ask,
Is the first row a header?
and
will display the first row in the
Row Items
box. If this row
contains the column names of the data file, then it is a header,
and you should click
Yes.
Examples of Column names are:
ID, Gender, Ethnicity, etc. If it is alphanumerical data (the
actual data only), you should click
No.
Click
OK
to confirm.
Select the Variables
The next screen (see pg 27) is where you tell the Importer
where to put the new data, column by column. The
Text File
Columns
box on the left contains the columns in the file to be
imported. The
QSP Variables
box contains the QSP database
Variables. The object here is to match the columns in the file
26
QSP User Guide
Identifying
the header
being imported to the Variables in the QSP database. Initially,
try clicking the
Automatch
button. This will pair up all the
text file columns and QSP Variables that have exactly the
same name. For the rest, you’ll have to go column by column.
First, select a column in the imported file by clicking it. If you
need to see what data is in that column of the file, look in the
Column Items
box. Next, select the matching QSP Variable
from those listed and click the
Select
button. The
Variable
Types
box explains the colored icons to help you select the
appropriate Variable. When you click the
Select
button, you
will note that the Variables disappear from their respective
boxes and appear together in the
Column/Variable Pairs
box. If
you make a mistake, click on the pair that is incorrect and
then click
Deselect
. Note that the column and Variable are
returned to the bottom of each list respectively.
If there are columns that you don’t want to include in this
Project, simply pair them up with
Ignore Item,
the last choice
in the
QSP Variables
box. You may also match all the Variables
you want first and then select the I
gnore the Rest
button
Importing Data
27
Matching
Variables
which will move all the remaining Variables to the
Column/Variable Pairs
box, listed as
Ignored.
Once you have
matched or ignored all your Variables, enter the year for the
data in the
Year
box. Click
Next
to continue.
Note
You can select the year for the data only once. So, if you have data
for multiple years of taking the same test, import the additional
years in separate import sessions. Be careful not to overwrite annual
data with data from an incorrect year.
The next screen is the
Import Summary
. It shows all of the
column/Variable pairs along with either check marks or Xs.
A check mark means that the match will import correctly into
the Data Manager. An X means that there is a problem. For
example, if you import a Numeric Decimal Variable that has 4
decimal places and the default for the file is set to 2 places, an
X will appear. You can click on
Edit Variable
and it will show
that the decimal places box is set to 2. You can enter 4
instead, and once you click
OK
, the X should change to a
check mark. Scroll down the list to make sure you have all
check marks then click
OK
.
The final screen gives you both naming and view options.
For your Variable names, you can either select the
Imported
file Variable names
, or the
Current QSP Variable names
.
Simply click the appropriate button. For the viewing of your
Variables, you have the option of putting the newly imported
Variables directly into the Database View. If you would like
to do so, then click the box next to this item so it is checked.
Click
OK
to finish.
QSP will now import your data. This may take several min-
utes depending on the size of your original file.
28
QSP User Guide
!
Using
Groups
Background
When looking at students’ information, it is often helpful to
limit a large, unwieldy database to only those students you
are currently interested in. This is where Groups come in.
When you import data into QSP, each Categorical Variable
(such as
Ethnicity
) is automatically broken down into its
component Groups (
Black, Asian,
etc.). In addition, Groups
are created for each Variable’s
Missing, Valid, Invalid, Not
Applicable,
or
Out of Range
data. You can then view, analyze,
and report on these Groups in any combination you like.
You can also create your own Custom Groups, or combine
Groups for even more specific analysis.
How do I
access Groups?
Go to the
Database
menu and select
Groups
, or simply click
on the Groups button (see Appx II). This will take you to the
Groups
dialog (see pg 30). At the top, you will see a box
labeled
Current Group
with the default
All Students
in gray.
This means that currently, your view of the database is not
restricted to any one Group (see
Database View
, pg 35). There
are three types of Groups:
System Groups, Custom Groups
and
Combo Groups.
System Groups are created by QSP upon
Using Groups
29
import and are based on the Variables imported. Custom
Groups are Groups that you create based on your own crite-
ria. Combo Groups are created by combining multiple Groups
to get very specific subsets of the database.
How do I create a Custom Group?
Click on the
New
button in the lower left-hand corner of the
Groups
dialog, and you will be presented with the
Add Group
dialog box. You can create either a new Custom Group or new
Combo Group. Click the
Custom Group
button, and then
click
OK
. You will now see the
Edit Group
dialog (see pg 31).
From a Categorical Variable
Here, we will create a Group to get all ethnicities other than
caucasian. Click on the down arrow next to
Variable
to
reveal all the Variables containing data and choose the
Variable of interest (
Ethnicity
). Click on the down arrow of
30
QSP User Guide
The Groups
Dialog
the next box to choose the comparison you would like to
make (in our example, the choice would be
Is Not
). Click on
the down arrow under
Value
and choose the appropriate
Category (in our example, the choice would be
White
). In the
Name
box, type in the name of your new Group. Click
OK
to
confirm.
From a Numerical Variable
The process here is identical, with a few exceptions. When
you select the
Variable
, QSP automatically shows you the
Variable’s range. This can help in determining the correct
Value
(which will be number instead of a Category). You have
several operators to choose from, such as “greater than,” (>)
“less than,” (<) etc. The
between
operator allows you select a
range for your Group, so you will need to enter two numbers
for the
Value
.
How do I create a new Combo Group?
To create a new Combo Group click on the
New
button in the
Groups
dialog, click the
Combo Group
button, and click
OK
Under the
Name
box type in the name of your new Combo
Group. Now choose the Groups that you want to define the
Using Groups
31
Creating a Group
Combo Group. For example, if you choose
90016, 90018, Black,
Female
and
Magnet
, it will give you all the black, female, mag-
net students who live in the 90016 and 90018 zip codes.
Clicking on any of the eight
Groups
pulldows will show you
the option
Set Group
. Clicking on this will take you to the
Groups
dialog, where you can highlight the Group of interest
and click OK. If you want to remove a Group, simply click on
its pulldown and select Remove Group.
Note
Choosing Groups within the same Variable will expand your Combo
Group (i.e. “Black”
OR
“White”). Choosing Groups from different
Variables will tighten your Combo Group (i.e. “Black”
AND
“Female”).
32
QSP User Guide
Creating a
Combo Group
!
How do I
edit, copy or delete a Group?
In the
Groups
dialog, click on the Group you want to edit
(you cannot edit System Groups) and then click
Edit.
Simply
change to fit your needs, and click
OK
.
If you want to make multiple Combo Groups that are very
similar to each other, you don’t have to recreate each one from
scratch. Just click on the Combo Group of interest (you can
only copy Combo Groups) and click
Copy
. You can then edit
the new Combo Group by adding or removing Groups (up to
eight) and changing its name.
To delete a Group, simply click on it (you cannot delete
System Groups) and click
Delete
. You will see a confirmation
dialog. Click
OK
to confirm.
Using Groups
33
34
QSP User Guide
Database
View
Background
There are five entries in QSP’s
View
menu. Two of of these
entries are different view options:
Toolbar
and
Status Bar.
Check marks appear to the left of these menu items to show
if they are selected or not. When
Toolbar
is checked, you will
see a column of tool icons (see pg 81) on the left side of the
QSP window. These icons are shortcuts to various functions in
QSP. When
Status Bar
is checked, a bar appears at the bottom
right-hand side of the QSP window which shows how many
records are in the current view and what Group is being
shown.
There are three different views that you can select in the
View
menu. They are
Database, Goals
and
Reports.
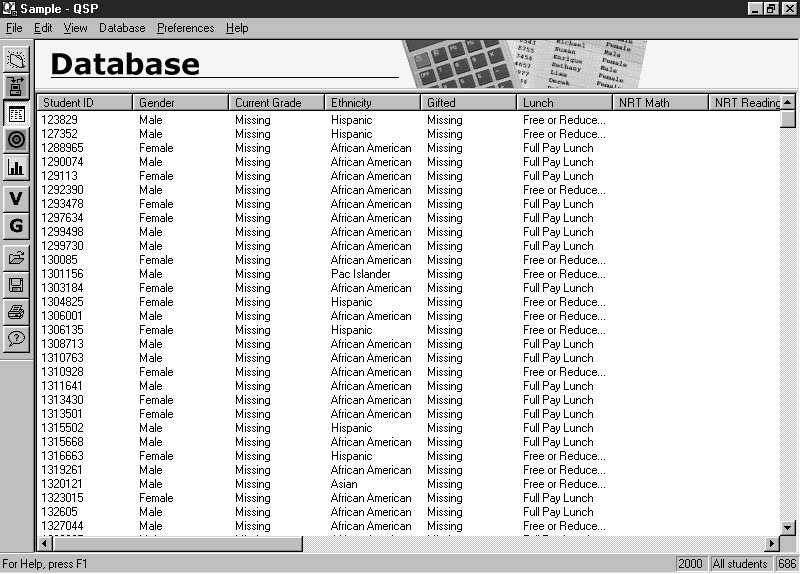
When you first
open a Project in QSP, you are taken to the
Database View
(see
pg 36), where you see the actual database in table (or spread-
sheet) format. Your “view” of this data can be changed by:
• Showing, hiding, or swapping Variables
• Sorting Variable records alphabetically or numerically
• Showing specific Groups
• Showing the Tab View of the database
• Adding or deleting students
Database View
35
How do I show,
hide, or swap a Variable?
To show a Variable
Right-click on the name of any Variable in the current view
(say,
Ethnicity
). You will see a popup menu. Scroll down to
highlight
Show Variable
and click to select. When the
Variables
dialog box appears, select the Variable you would
like to add and click
OK
. The Database View will be updated
with the new Variable added (placed to the right of
Ethnicity
).
To hide a Variable
Right click on the name of the Variable you want to hide and
select
Hide Variable
from the popup menu. The Database
View will be updated, and the Variable you hid will no longer
be in view.
36
QSP User Guide
The Database
View
To swap a Variable
Right click on the name of the Variable you want to replace.
Scroll down the popup menu to highlight
Swap Variable
and click to select. When the
Variables
dialog box appears,
select the Variable you would like to add and click
OK
. The
Database View will be updated to show the new Variable in
place of the old.
Note
When you replace or hide a Variable, it will be removed from the
current view. However, the underlying database still contains that
Variable and the information (records) related to it.
How do I sort
Variable records?
Click on the name of the Variable you want to sort in the
Database View. A screen will appear asking if you want to sort
the records. Click
OK
to confirm. The screen will refresh itself
and show the database sorted from A-Z, or from lowest num-
ber to highest, based on that Variable’s records.
How do I view a Group?
To view the Group you are interested in, go to the
Database
menu and choose
Groups
, or click the
Groups
button
(see Appx II). Select the Group you want from any of the three
sections, System, Custom or Combo, and click
OK.
For
System
Groups,
you need to scroll to the Variable you are interested in
and then click on the + icon to the left of the Variable name.
This expands the Variable to show the Groups that are related
to it. After selecting a Group and clicking
OK,
you will be
returned to the Database View. Notice that only the students
from the selected Group are available.
Database View
37
!
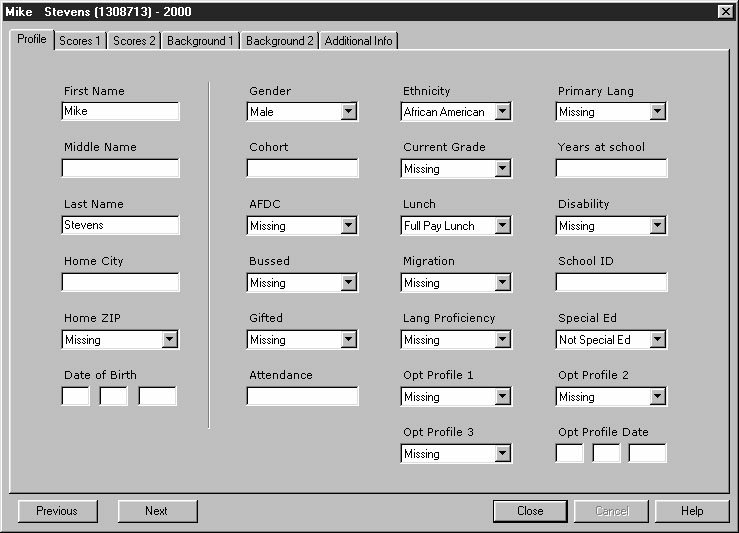
What is the Tab View?
The Tab View (see below) allows you to directly access and
edit each student’s particular information. Simply double-
click anywhere on a student’s row in the Database View, and
the Tab View for that student will appear. Every Variable in
QSP (whether or not it contains data) is laid out across six dif-
ferent tabs. You can move between each tab by clicking the
mouse on the tab you are interested in. To go to the next stu-
dent, click on
Next
in the lower left corner of the Tab View. To
go to the previous student, click on
Previous
.
Note
The Tab View only shows the students within the specific Group you
have chosen in the Database View. So, when you click forward or
back, you will get the next student in that Group, possibly skipping
other students in the database.
38
QSP User Guide
The Tab View
!
How do I add or
delete a student?
To add a student
Go to the
Database
menu and select
Add Student.
In the dia-
log box, enter the ID number and appropriate year for the stu-
dent. The
Profile
tab of the Tab View will appear. Type in the
student’s name and other background information. Select the
other tabs (
Scores 1, Scores 2,
etc.) and enter the appropriate
information. Click
OK
to confirm.
To delete a student
In the Database View, click on the student’s ID number to
highlight it. Go to the
Database
menu and select
Delete
Student.
Click
OK
to confirm.
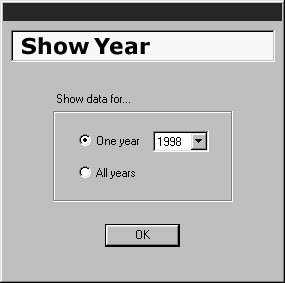
How do I show one Year’s data?
Select
Show Year
from the
Preferences
menu. When the
Show
Year
dialog comes up, click the button next to
One year
to acti-
vate it. Next, use the
Year
pulldown to select the year that you
are interested in. Click
OK
to confirm. When you return to
the Database View, the year you have chosen will appear in
Database View
39
The Show Year
Dialog
the bottom right corner (in the leftmost box of the status bar),
and only that year’s data will be in view.
Note
When you use Show Year, all other years’ data will be removed from
the current view. However, the underlying database still contains
those years and the information (records) related to them.
To view the data for all years in the database, return to the
Show Year
dialog and click the button next to
All years
. The
Year
box will grey out. Click
OK
to confirm. When you
return to the Database View,
All years
will appear in the bot-
tom right corner (in the leftmost box of the status bar), and
the data for all years will be in view.
How do I save my Project?
In the Database View, simply go to the
File
menu and select
Save
. If you want to make a duplicate of your Project, select
the
Save As…
option. You will see a dialog asking you to
enter the new Project’s
Name
. Do so and click
OK
. The pass-
word dialog will appear. Enter the password for the original
Project and click
OK
. QSP will save and close the original
Project and open the new duplicate Project. You can change
the password of your new Project by going to the
Edit
menu
and selecting
Change Password
.
Note
The Save As... option is helpful if you want to make a base Project
(with all the necessary import matchings, Variable names, Charts,
etc.) and then use it as a template for other Projects.
40
QSP User Guide
!
!
Working
with Goals
Background
Goals allow you to set standards for a Group of students,
and then track those standards in the context of specific
Targets. Goals for your school should be set by a Site-Based
Management Team (SBMT) composed of the key stakehold-
ers for student progress at your school: teachers, adminis-
trators, parents, and community leaders. Goal setting
should go hand in hand with the school planning process.
Be very specific in defining your Goals. Be sure to include:
the types of Goals, when you hope to reach them, how you
will measure progress, and what plan of action will help
you reach your Goals.
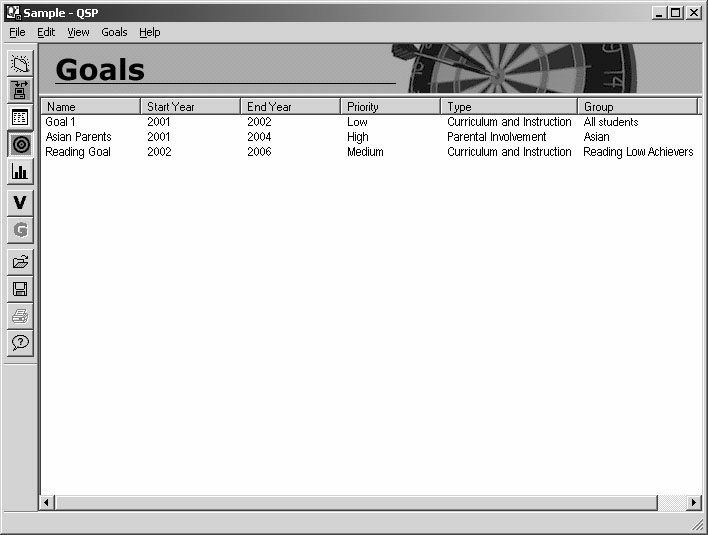
How do I create Goals?
Go to the
View
menu and select
Goals.
This takes you to
the Goals View (see pg 42), where you will see an empty
chart with columns labeled
Name, Target Year, Priority, and
Type.
(This will eventually hold the Goals you create.) Go to
the
Goals
menu and select
Add Goal.
Working With Goals
41
Creating a Goal
When you create a new Goal, you will first be presented with
the dialog below. Enter the
Name
of the Goal, select the
Group
of interest, and decide how many Targets this Goal
will contain by clicking on one of the three radio buttons.
Next, decide which
Area
this Goal concerns by clicking on
the pulldown menu. Your choices here are identical to the
six Areas of the QSP Resource Kit:
Curriculum and Instruction
Technology and Innovation
Professional Development
Parental Involvement
Safety and Security
Special Programs
Next, select the
Priority
(High, Medium, Low) and the
Start
and
End
years for this Goal. Enter the name of the
Goal
Monitor.
This should be someone from your Site-Based
Management Team who can best observe and help the
progress of this Goal.
42
QSP User Guide
The Goals View
Finally, type in the
Goal Plan
, or how you hope to achieve
your Goal, with some key milestone dates you would like to
keep. Here’s an example: For a Goal of increased perfor-
mance in Language Arts, you might implement a professional
development seminar on new instructional techniques for stu-
dent writing. You might also implement an after school read-
ing program, or invite parent volunteers to come and read to
children. In your Plan, it’s a good idea to enter start dates for
activities or action items. Once you’ve completed your Plan,
click on
Next
to continue.
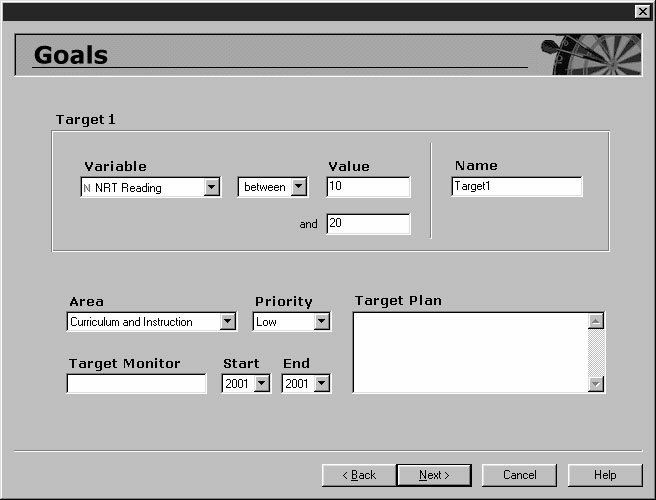
Setting Targets
The next series of screens (see pg 44) deal with the creation of
up to three specific Targets for your overall Goal. When you
make a Target, you are essentially making a Group of poten-
tial students. For this reason, Target creation is almost identi-
cal to Group creation (the exception being that you can only
choose an Annual Variable in your Target).
Working With Goals
43
Creating a Goal
In the
Target 1
box, select the
Variable
, operator,
Value
, and
Name
just as you would in creating a Group (see pp 30-31).
Next, choose the
Area
,
Priority
, and
Start
and
End
years for
this Target. The
Target Monitor
may be the same person as
the Goal Monitor, or someone assigned to the progress of this
particular Target. Finally, enter the
Target Plan
. Click
Next
when you are done. Depending on how many Targets you
have, you will see this same screen for Target 2 and Target 3.
Fill in the appropriate information as above, and click
Next
to
get to the
Summary
screen.
Goal Summary
This screen contains two boxes. The
Goal
box shows an
overview of the Goal, including the Goal’s Name, Priority, etc.
The
Target
box shows the Name, Priority, etc. for Target 1.
Click the
2
or
3
buttons to see the overview for Target 2 or
Target 3. (If you only have one Target, then these will be
greyed out.) Review all the information and decide if you
would like to change anything. If so, then click on the
Back
button until you reach the appropriate screen, edit where
necessary, and click
Next
until you get back to this screen.
44
QSP User Guide
Creating a Target
When all the information is correct, click the
Finish
button.
You will now see your new Goal listed in the Goals View
with its
Name, Target Year, Priority,
and
Type
listed.
Editing a Goal
To edit a Goal, double-click its name in the main Goals View.
You will notice that the screens used in creating the Goal now
appear as tabs. Click on the appropriate tab and edit where
necessary. Note that you cannot add or delete Goal Targets
here. If you want a different number of Targets, you will
need to create a new Goal from scratch.
Deleting a Goal
To delete a Goal, select
Delete Goal
from the
Goals
menu.
You will get a dialog box asking which Goal to delete. Click
the down arrow and highlight the Goal you wish to delete.
Click
OK
to confirm. The next dialog box will ask to confirm
deletion of the Target Groups. Click
OK
to confirm.
Note
When you create a Goal, a Group is automatically created for each
Target, as well as the Goal itself. These can be accessed in the
Groups dialog under
System Groups
. When you delete a Goal, all
associated Target Groups are deleted as well.
Working With Goals
45
!
46
QSP User Guide
Reports
View
Background
QSP allows you to create various charts, graphs, and tables
to represent your data. These Charts and Reports can be com-
piled in your favorite word processing program with added
explanations and headings to generate informative accounts
for various audiences.
How do I
build Charts?
Go to the
View
menu and select
Reports
, or click the
Reports
button (see Appx II). This takes you to the Report View (see
pg 48), where you will see an empty table with columns
labeled
Name, Year, Type, Date Created,
and
Groups of Interest.
(This will eventually hold the Charts and Reports you create.)
Go to the
Reports
menu and select
New Chart.
A submenu
will appear with all of the possible choices. Simply click on
the type of Chart you would like to generate. Alternately, you
can click on one of the Report Toolbar buttons (see Appx II) to
take you to the Chart dialog of your choice.
Reports View
47
Before creating Charts, it is important to understand a few
conventions that are present in most of the Chart dialogs.
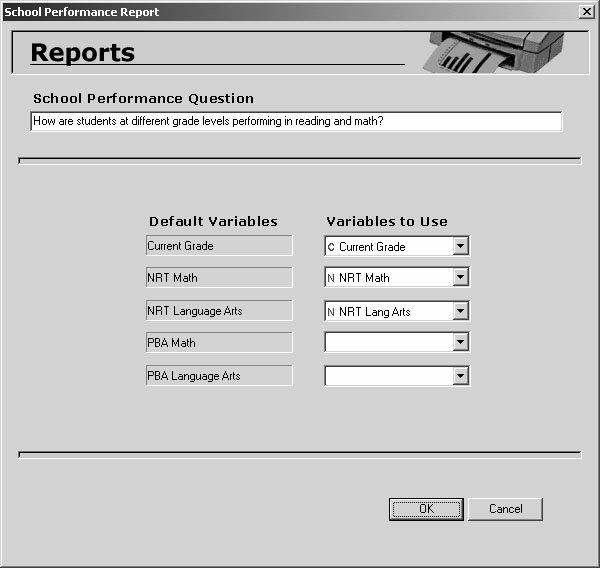
Questions
In creating each Chart, you are essentially asking a question.
When there is an option, QSP allows you to ask one of five
questions:
How many?
This is for Categorical Variables only. Use this
to get a count for each relevant Group.
What percent?
This is for Categorical Variables only. Use this
to find the percentage each relevant Group
occupies of the total.
What is the
This is for Numerical Variables only. Use this
average?
to get the mean score on tests, etc.
What is the
This is for Numerical Variables only. Use this
middle score?
to get the median score on tests, etc.
What
% scored
This is for Numerical Variables only. Use this
at or above?
to get the percentage of students who scored
at or above a certain cut point.
48
QSP User Guide
The Reports View
Add and Remove
In deciding what Variables and Groups to include in your
Charts, you can be very flexible. Many Chart dialogs have
a box or boxes with the buttons
Add
and
Remove
below. To
add items to the box, click on Add. For Variables, this will
take you to the
Variables
dialog. Simply scroll down and select
the Variable to add, then click
OK
. Keep adding Variables this
way until you are done. For Groups, clicking on
Add
will
take you to the
Groups
dialog. Here, you can click on a Group
of interest and click
OK
to add. To remove a Group or
Variable from the Chart you’re building, simply highlight it
and then click
Remove.
Repeated Elements
The Chart dialogs are all divided into three sections. The
top and bottom sections contain elements which remain
consistent throughout most of the Chart dialogs:
The top section always contains (except in special cases)
the
Group
pulldown and the
Year
pulldown. Use these
to limit your report to a specific Group and/or year.
The bottom section always contains the
Title
edit box.
Your Chart must have a title.
The middle section contains all of the elements that are
unique to that particular Chart
.
Accessing Charts
To get to a Chart dialog, select New Chart from the Reports
menu, then select the Chart. Or, simply click the Chart button
of your choice on the Report Toolbar (see Appx II).
Descriptions of each Chart follow...
Reports View
49
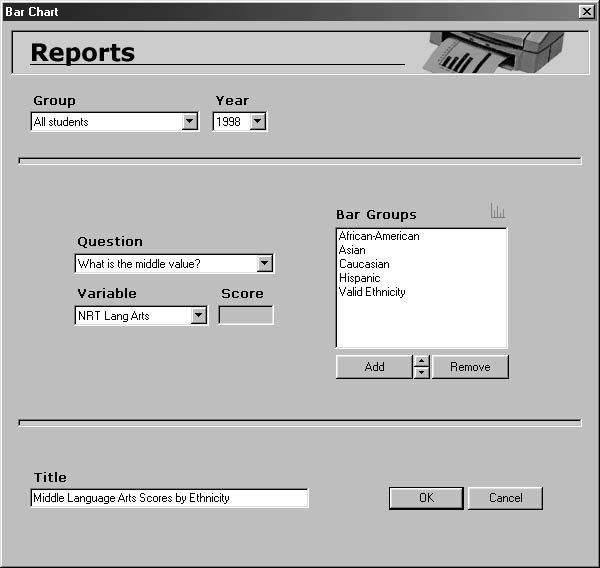
Bar Chart
1. Select the question you wish to ask. If you ask
How many?
or
What percent?
then the Variable pulldown will grey, and
step two will not be neccesary.
2. If you asked
What is the average?
or
What is the middle value?
then select the Variable you wish to investigate. If you
asked
What percent scored at or above?
then select a Variable
and enter the cutpoint in the
Score
box.
3. Add the Groups you are interested in here. Each Group
you add will be represented as a bar in the Chart.
4. Enter the
Title
of your Chart.
Click
OK
to confirm.
50
QSP User Guide
1
2
3
4
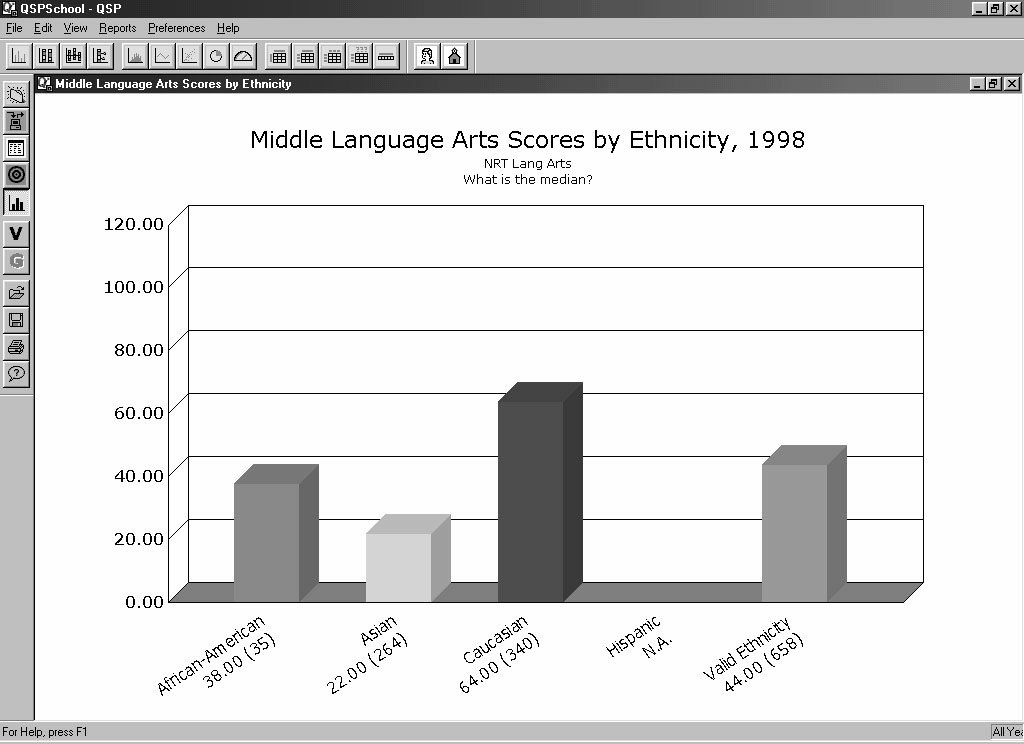
Here is the Bar Chart generated by our example. Each bar
represents the median score of each Group on the Variable
NRT Language Arts
. The decimal number next to each Group
name is the median, and the number in parenthesis is the
Count.
Reports View
51
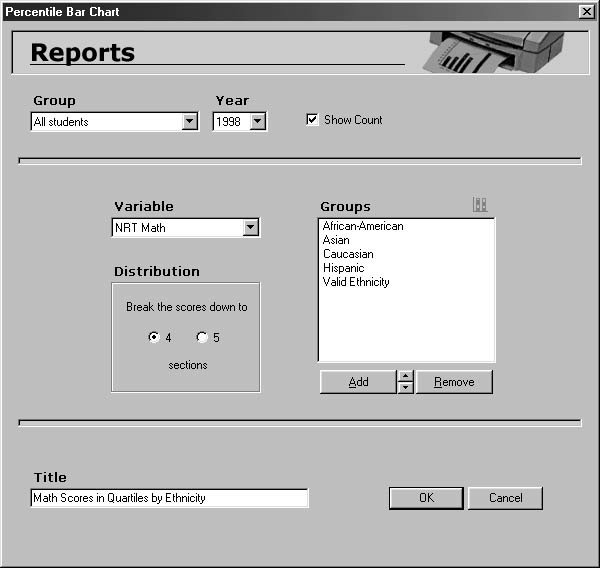
Percentile Bar Chart
1. Choose the Variable you wish to examine by clicking on
the down arrow and selecting the Variable of your choice.
Here, selecting
NRT Math
will get you the range of scores
for that outcome.
2. Select how many color-coded ranges you want to split the
Variable scores into by clicking either
4
(quartiles) or
5
(quintiles). For
NRT Math
(scores from 0-99), selecting
quartiles will create 4 ranges: (0-24), (25-49), (50-74), (75-99).
3. Add the Groups you are interested in here. Each Group
you add will be represented as a bar in the Chart.
52
QSP User Guide
1
2
3
4
5
4. Checking the
Show Count
box will give you the number,
in parenthesis, of individual students for each Group you
have chosen.
5. Enter the
Title
of your Chart.
Click OK to confirm.
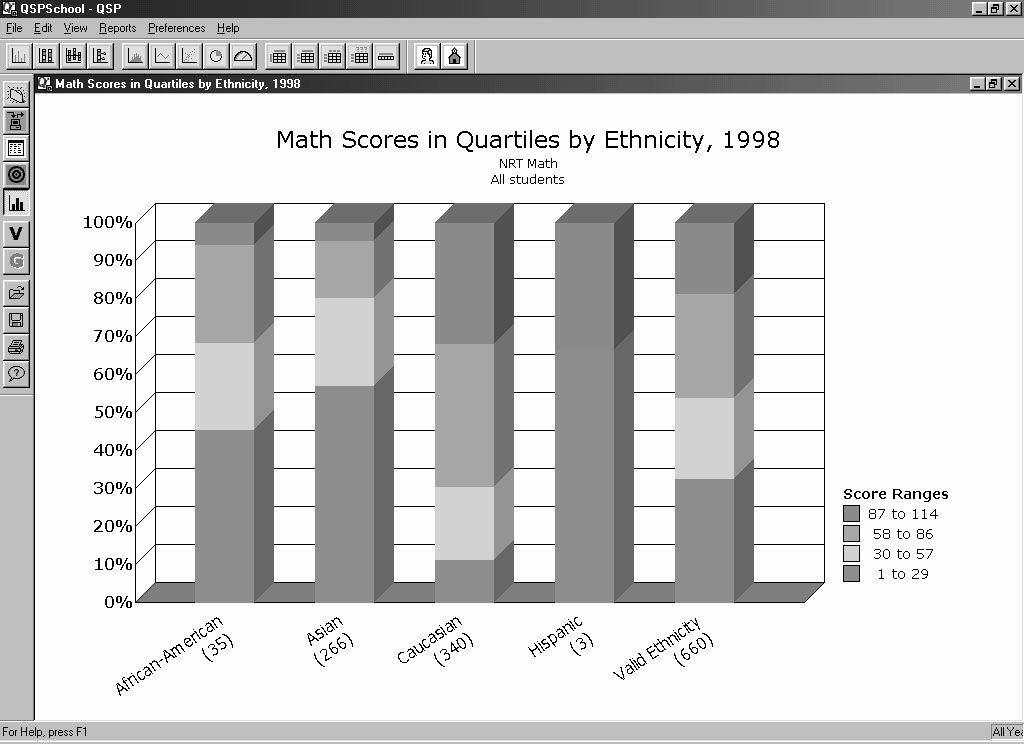
Here is the Percentile Bar Chart generated by our example.
Think of each bar as an individual Pie Chart for each Group.
For instance, we can see that out of the 266 Asians who took
the NRT Math test, 57% scored in the lowest range, 23%
scored in the next range, 15% scored in the next range, and 5%
scored in the highest range.
Reports View
53
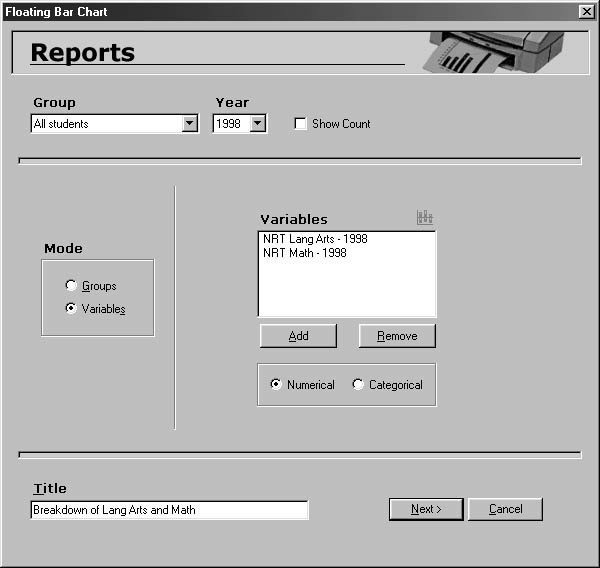
Floating Bar Chart
1. Choose the
Mode
for your Floating Bar Chart. Clicking on
Groups
will give you the above dialog box and will gener-
ate a Chart analyzing how certain Groups performed on a
certain test (Annual Variable).
2. Add the Groups you are interested in here. Each Group
you add will be represented as a bar in the Chart.
3. Choose the
Variable
by clicking on the down arrow and
selecting the Annual Variable of your choice. Here, we
have chosen
NRT Lang Arts
.
4. Checking the
Show Count
box will give you the number, in
parenthesis, of individual students for each Group you
have chosen.
54
QSP User Guide
Groups Mode
1
2
3
4
5
5. Give the Floating Bar Chart a title.
Click Next to continue.
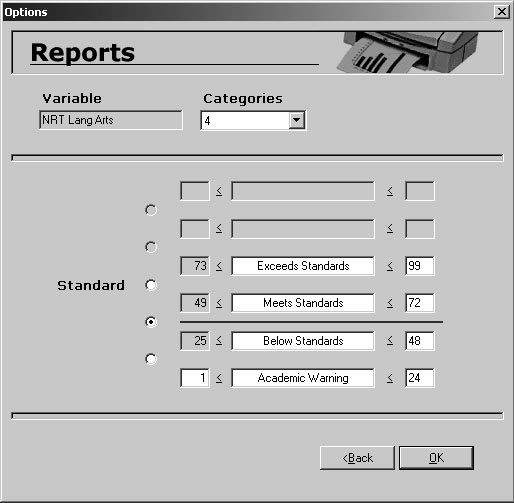
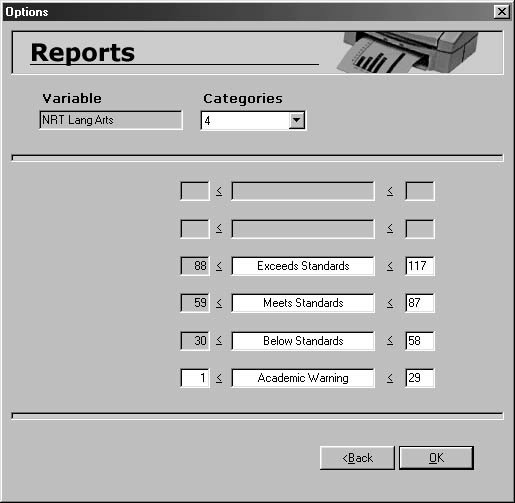
Once you do, the
Options
dialog box will appear.
1. Select the number of
Categories
, or ranges, you want to
divide your Variable into (from three to six levels). Here,
we are splitting the results of
NRT Lang Arts
into 4
possible Categories.
2. Enter the values that define the range of each Category.
3. Enter titles for each Category, or you can leave the pre-
defined Categories shown above.
4. Select the
Standard
for the Floating Bar Chart. Scores falling
above the Standard will be represented in shades of green,
scores falling below in shades of red.
Click
OK
.
Reports View
55
Setting the
Standard for a
Numerical
Variable
4
1
2
3
Here is the Floating Bar Chart generated by our example. The
results are very similar to the Percentile Bar Chart, except that
the bars are shifted relative to the
Standard
.
56
QSP User Guide
Choosing the
Variables
Mode will give you this dialog:
This will generate a Chart analyzing how one Group
performed on multiple tests (Annual Variables).
1. Decide if the Variables you want to analyze are going to be
Categorical
or
Numerical
(they all must be the same Type).
2. Add the Variables you are interested in here. Each Variable
you add will be represented as a bar in the Chart.
3. Checking the
Show Count
box will give you the number,
in parenthesis, of students who took each test you have
chosen.
4. Give the Floating Bar Chart a title.
Click Next to continue.
Reports View
57
Variables Mode
4
1
2
3
If you have selected
Numerical
Variables, you will get the
same
Options
dialog box seen on page 55. Select the
Categories and Standard as you do there. However, if you
have selected
Categorical
Variables, then you will get the
following
Options
dialog box:
1. The Variables’ Categories are listed here, in ascending
order. If you would like to change a Category’s position,
click on it’s name to highlight it, then click the up/down
arrows next to
Change Order
.
2. Select the
Standard
via the pulldown menu. The Category
you select as the Standard will be the first (green-shaded)
one
above
the Chart’s Standard line.
Click
OK
to finish.
58
QSP User Guide
Setting the
Standard for a
Categorical
Variable
2
1
Note
When adding Categorical Variables to a Floating Bar Chart, keep in
mind that all Variables added must have the same exact Categories,
or they will not appear in the Chart.
Here is the Floating Bar Chart generated by our (Numeric
Variable) example. Notice that each bar represents the
performance on each test (
NRT Lang Arts
and
NRT Math
) by
one Group (
Asians
).
Reports View
59
!
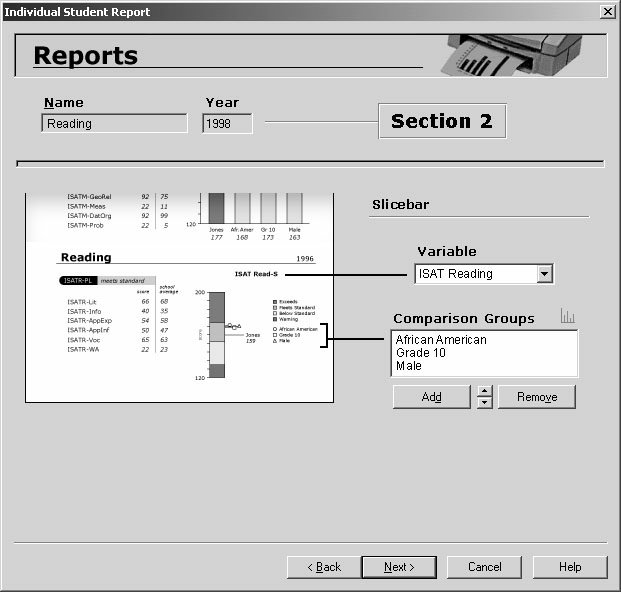
Slicebar Chart
1. Select the question you want to ask, either
What is the
average?
or
What is the middle value?
2. Select the
Variable
. This is the test, or outcome, you will
be analyzing. We have selected
NRT Lang Arts
.
3. Select the
Main Group
. Here, selecting
3rd Grade
will give
us the median score for all 3rd graders on
NRT Lang Arts
.
4. Add up to four
Comparison Groups
. The median score for
each of these Groups will be charted as well.
5. Checking the
Show Count
box will give you the number of
students in each Group you have chosen.
6. Enter
Title
of your Chart.
Click
Next
to continue.
60
QSP User Guide
1
2
3
4
5
6
Once you click
Next
, the following dialogue box will appear.
1. Select the number of
Categories
, or ranges, you want to
divide your Variable into (from three to six levels). Here,
we are splitting the results of
NRT Lang Arts
into 4
possible Categories.
2. Enter the values that define the range of each Category.
3. Enter titles for each Category, or you can leave the pre-
defined Categories shown above.
Click
OK
.
Reports View
61
1
2
3
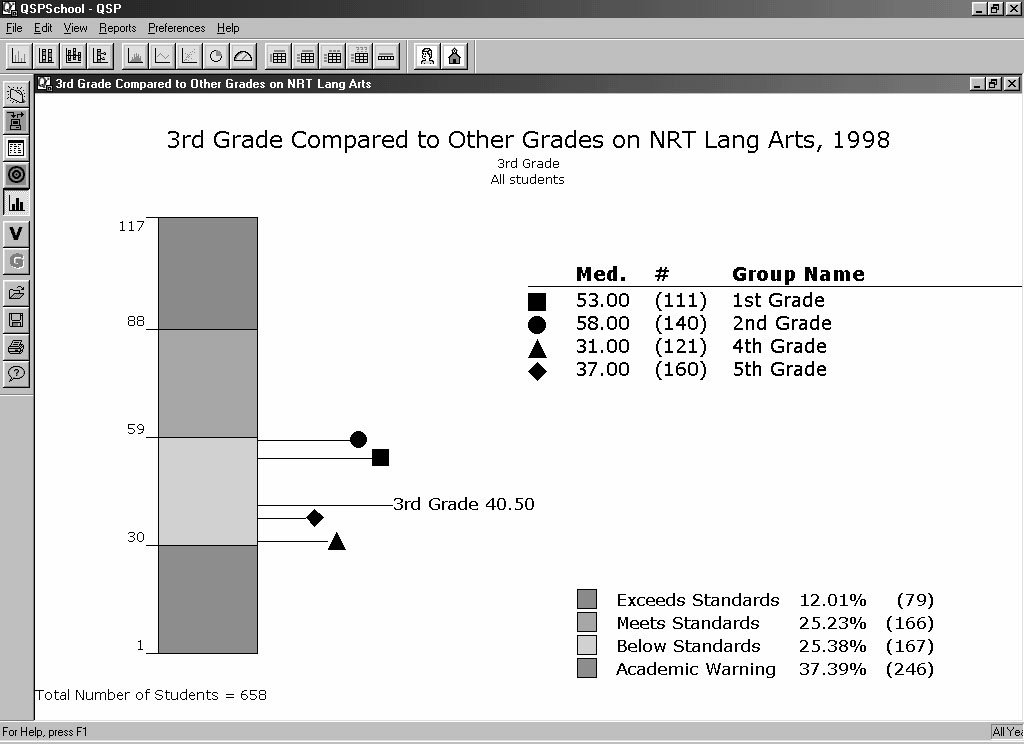
Here is the Slicebar Chart generated by our example. Notice
that the Variable,
NRT Lang Arts
, is divided into four color-
coded sections. The Main Group,
3rd Grade
, is named directly,
while the Comparison Groups are represented by icons within
the Chart.
62
QSP User Guide
Histogram
1. Choose a
Variable
by clicking on the down arrow and
selecting the Annual Numerical Variable you wish to
examine. Here, we have selected
NRT Math
.
2. Enter the
Bar width
. The wider you make each bar, the
fewer bars (score ranges) will be represented in the
Histogram.
3. If you would like to see the
Mean
and
Standard Deviation
of
the results, then check this box.
4. If you would like the
Normal Curve
drawn over the bars,
then check this box.
5. Enter
Title
of your Chart.
Click
OK
.
Reports View
63
1
2
3
4
5
Here is the Histogram generated by our example. The entire
range of scores for
NRT Math
(1-99) has been broken up into
equal intervals (15) represented by each bar. The height of
each bar shows how many students scored within that
particular range.
64
QSP User Guide
Line Graph
1. Enter the range of years for your Line Graph.
2. Choose the
Mode
for drawing. You can use either lines or
bars to represent your data. Here, we have chosen lines.
3. If you want to know how various Groups (up to 8)
performed on a certain test (Annual Numerical Variable),
click on the
Groups
button. You will see the dialog above.
4. Select the question you want to ask. You can ask either
What is the average?
or
What is the middle value?
5. Choose the
Variable
you want to examine. Here, we have
chosen
NRT Math
.
6. Each Group you add here will be represented as a line in
the Chart.
Reports View
65
Groups Mode
2
3
1
4
5
6
7
8
7. Choose the
Type
of calculation. If you choose
Cross sectional,
all students in each Group will be calculated. If you choose
Longitudinal
, only students with data in
all the years
of the
graph will be calculated. You can show what percentage
those students account for by checking the
Show %
box.
8. Enter
Title
of your Chart.
Click
OK
.
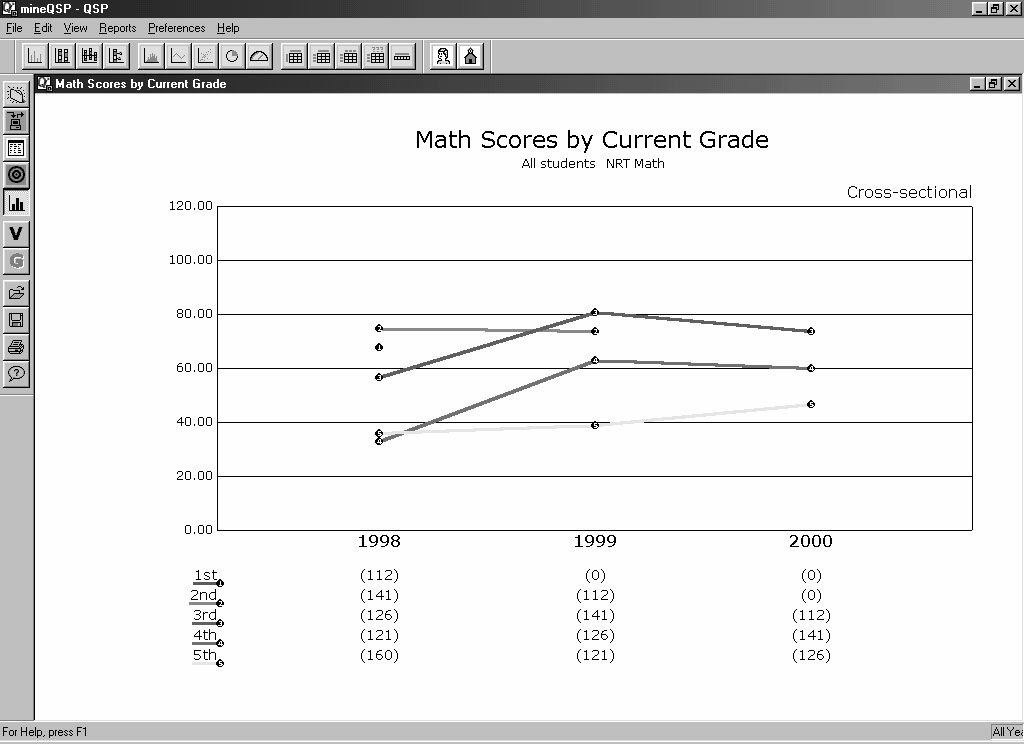
Here is the Line Graph generated by our example. Each line
represents each grade’s median scores on
NRT Math
from
1998-2000.
66
QSP User Guide
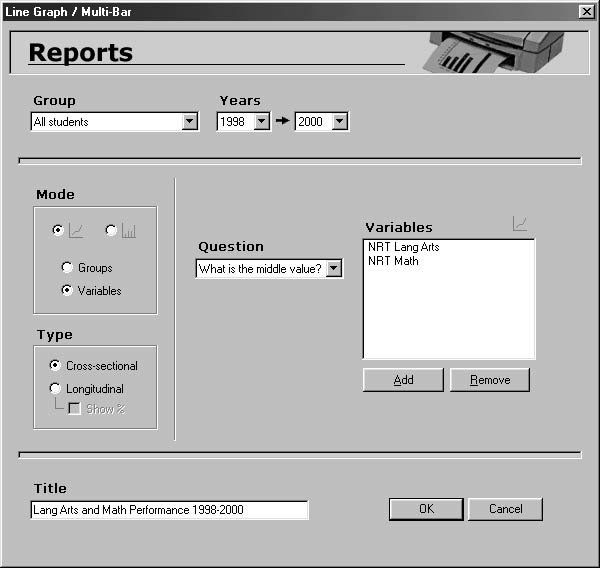
1. If you want to know how one Group performed on various
tests (Annual Numerical Variables), click on the
Variables
button. You will see the dialog below.
2. Each Variable you add here will be represented as a line in
the Chart. Here, we have chosen
NRT Lang Arts
and
NRT
Math
.
Everything else in the dialog box works the same as it did in
Groups Mode.
Click
OK
.
Reports View
67
Variables Mode
1
2
Here is the Line Graph generated by our example. Each line
represents the Group’s (
Asian’s
) median scores on each test
from 1998-2000. Here, we only have two lines; one for
NRT
Math
, and one for
NRT Lang Arts
.
68
QSP User Guide
Scatter Plot
1. Select the first Group of interest by clicking on the down
arrow and choosing
Set Group
. Here,
Male
is selected.
2. If you would like to compare another Group to the first,
then check the
Group 2
box and select
Set Group
. Here,
Asian
is selected. If you only want to look at one Group’s
performance, then make sure this box is unchecked.
3. Choose the
X Variable
(horizontally plotted) by clicking on
the down arrow and selecting your choice. Also, select the
Year
for the Variable. Here,
NRT Math 1998
is selected.
4. Next, choose the
Y Variable
(vertically plotted) and
Year
.
Here,
NRT Lang Arts 1998
is selected.
5. Enter
Title
of your Chart.
Click
OK
.
Reports View
69
1
3
4
2
5
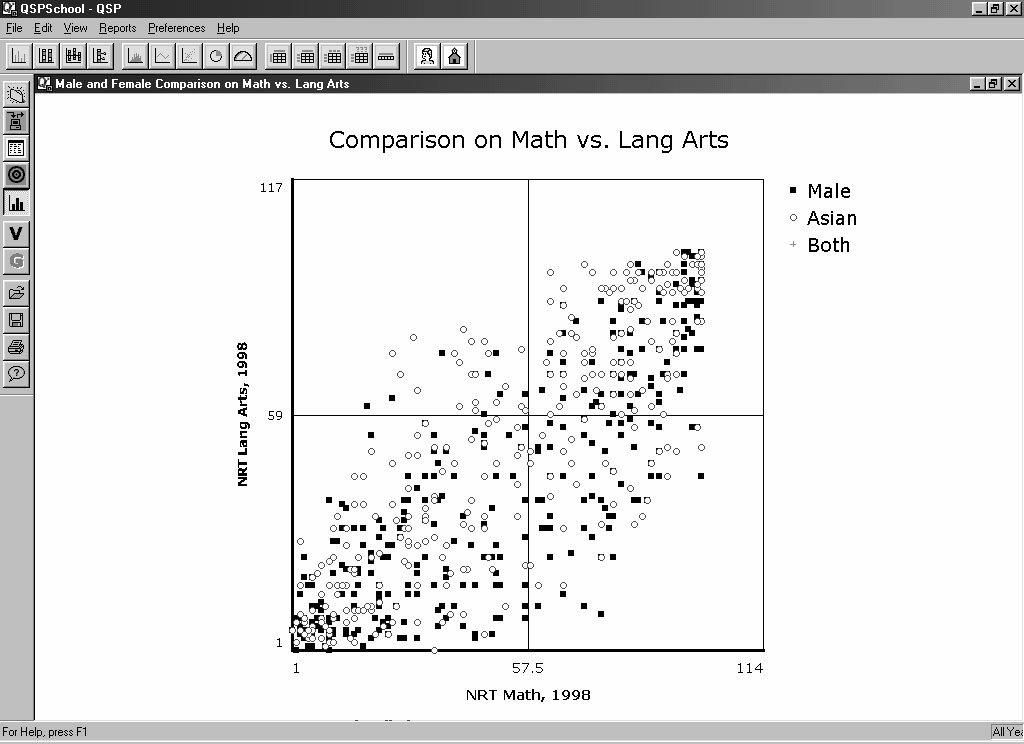
Here is the Scatter Plot generated by our example. The blue
circles mark each
Male
’s score on
NRT Math 1998
horizontally
against his score on
NRT Lang Arts 1998
vertically. The red
plus signs mark each
Asian
’s scores in the same manner. The
black filled squares indicate the scores for students that are
both
Male
and
Asian
.
Note
In the Chart, the circles and plus signs are mutually exclusive. For
instance, in this example, the circles represent all students that are
(Male
and not
Asian). The plus signs represent those that are
(Asian
and not
Male). The squares represents those that are both
(Male
and
Asian).
70
QSP User Guide
!
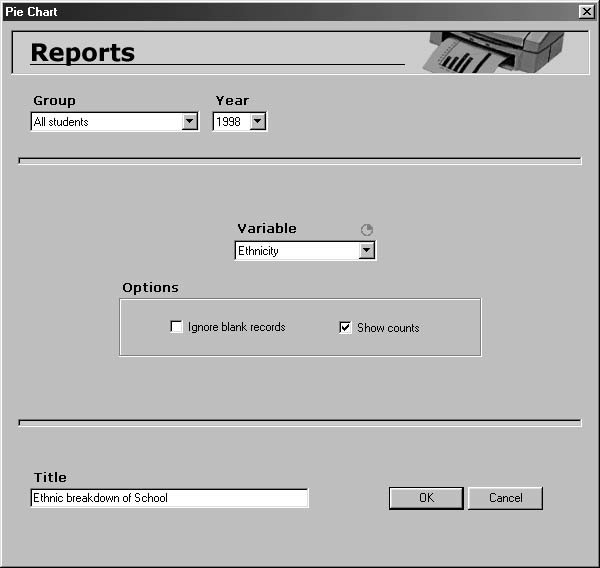
Pie Chart
1. Choose the appropriate Variable by clicking on the down
arrow and scrolling to your choice. Here, selecting
Ethnicity
will get you “wedges” of ethnic groups such as
White,
Black,
or
Asian
.
2. Check
Ignore Blank Records
if you wish to eliminate the
Missing
Group from the Chart.
3. Check
Show Counts
if you want to display the number of
students in each Group.
4. Enter
Title
of your Chart.
Click
OK
to confirm.
Reports View
71
1
2
4
3
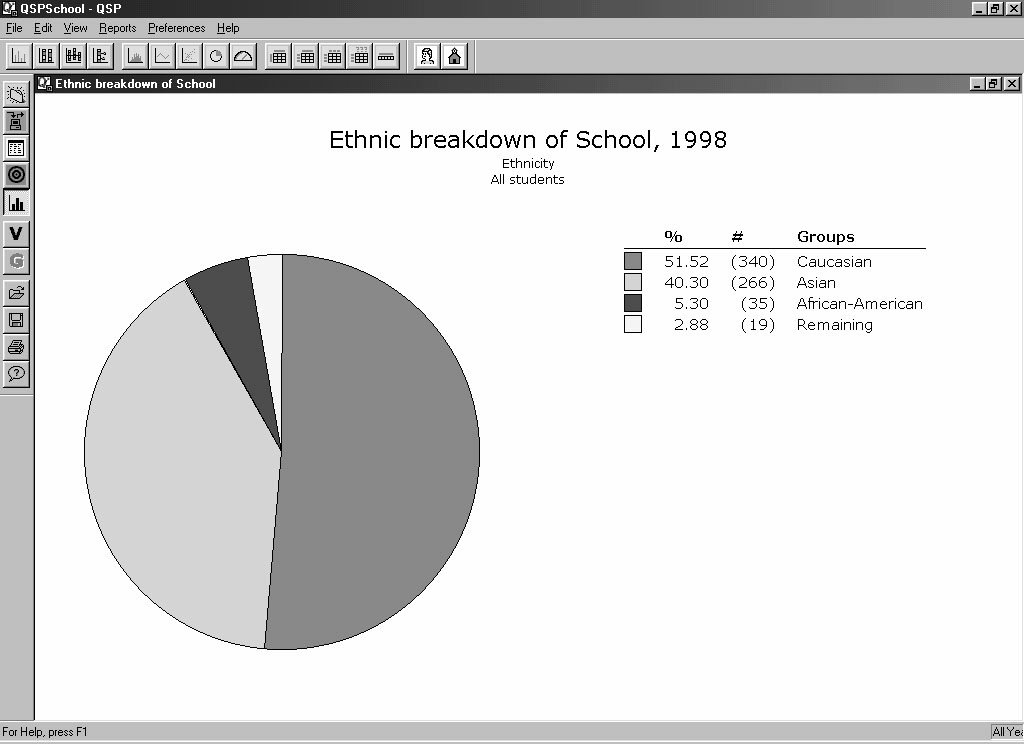
Here is the Pie Chart generated by our example.
72
QSP User Guide
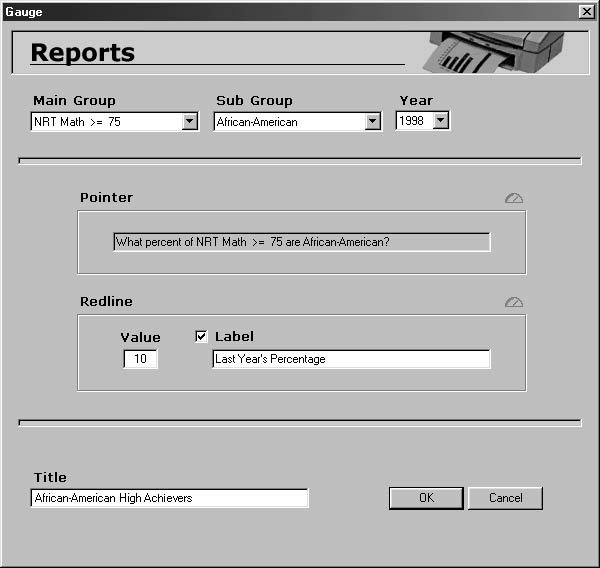
Gauge
1. Choose the appropriate Main Group first by clicking on
the down arrow and selecting
Set Group
. Here,
NRT Math >= 75
is selected.
2. Next, choose the appropriate Sub Group by clicking on
the down arrow and selecting
Set Group
. Here,
African-American
is selected.
3. The
Pointer
essentially answers the question “What percent
of
(Main Group)
are
(Sub Group)
?” Your selected Groups are
entered here for clarification.
4. If you like, you can also include a
Redline
percentage that
can serve as a comparison to the Pointer percentage. This
Reports View
73
1
3
4
2
5
6
is not calculated by QSP, but rather provided by you.
Simply enter the correct percentage of whatever value you
would like compared.
5. Also, a
Label
may be included to explain what the Redline
comparison percentage is. If you want to include a Label,
check the box and enter a short, descriptive phrase. Here,
the comparison percentage is
Last Year’s Percentage
.
6. Enter
Title
of your Chart.
Click
OK
.
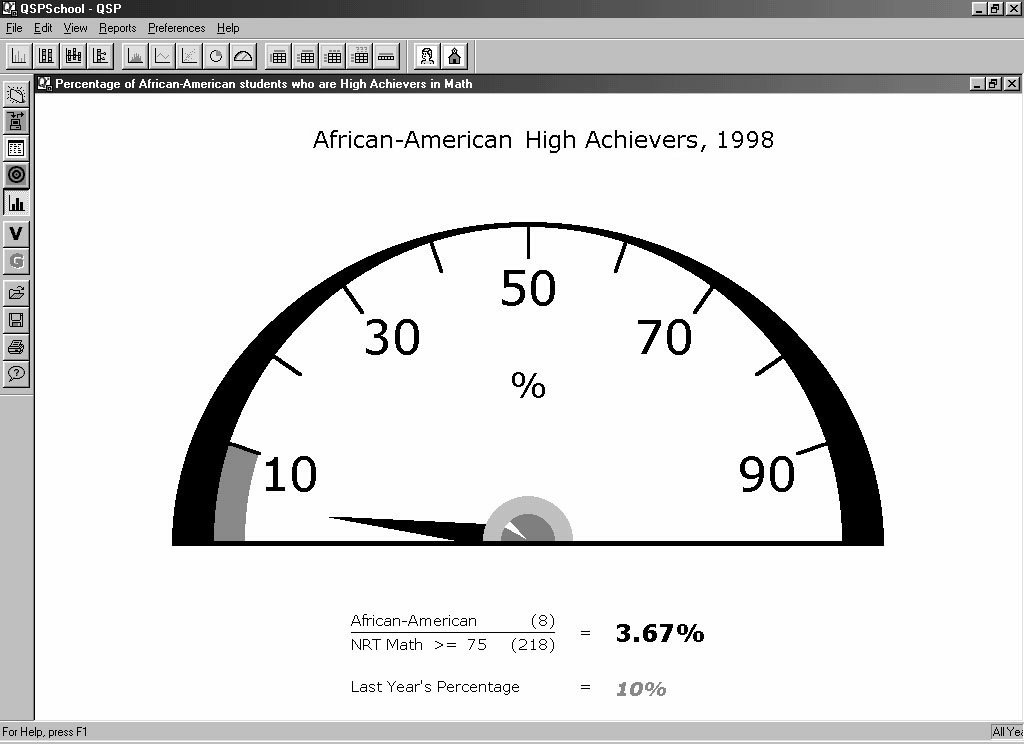
Here is the Gauge generated by our example.
74
QSP User Guide
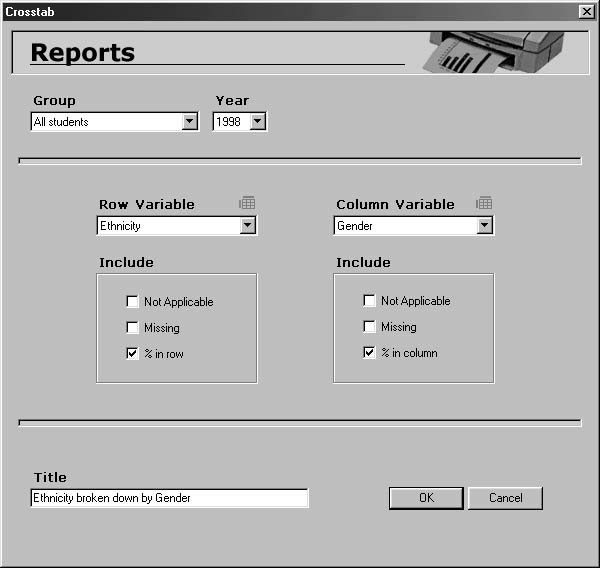
Crosstab
1. Choose the appropriate Row Variable by clicking on the
down arrow and scrolling to your choice. Here,
Ethnicity
will give you rows of
Asian, Caucasian, Hispanic,
etc.
2. If you want to include
Missing
or
Not Applicable
data in
the rows of your Crosstab, check the appropriate boxes.
3. The Crosstab Report only gives you counts (thus, no
Question
box), but if you want to calculate the percentages
in the rows as well, check
% in row
.
4. Choose the appropriate Column Variable in the same way
as the Row Variable. Here, selecting
Gender
will give you
columns of
Male
and
Female
.
Reports View
75
1
2
3
4
5
6
5. Check the
Include
boxes for
Not Applicable
,
Missing
, or
% in column
as needed.
6. Enter the
Title
for your Chart
Click
OK
.
Here is the Crosstab generated by our example. It breaks
Ethnicity
down by
Gender
and gives you the number
(and percentage) of
Male
and
Female
students within each
ethnic Group.
76
QSP User Guide
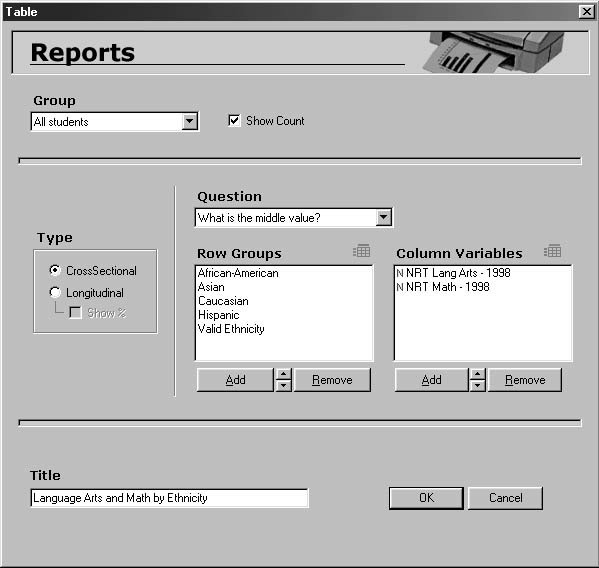
Table
1. Select the question you want to ask. Since Tables only deal
with Annual Numerical Variables, you can only ask
What is
the average?
and
What is the middle value?
2. Choose the
Type
of calculation. If you choose
Cross
Sectional
, all students in each Group will be calculated. If
you choose
Longitudinal
, only students with data in
all
years
of the graph will be calculated. You can show what
percentage those students account for by checking the
Show %
box.
3. Add the
Row Groups
here (up to 8). Here, we have selected
various ethnic Groups.
Reports View
77
1
2
3
4
5
6
4. Select the
Column Variables
here (up to 8). Here, we have
selected
NRT Lang Art 1998
and
NRT Math 1998
.
5. Check the
Show Count
box if you want the Table to show
the number of students in each cell (in parenthesis).
6. Enter
Title
of your Chart.
Click
OK
.
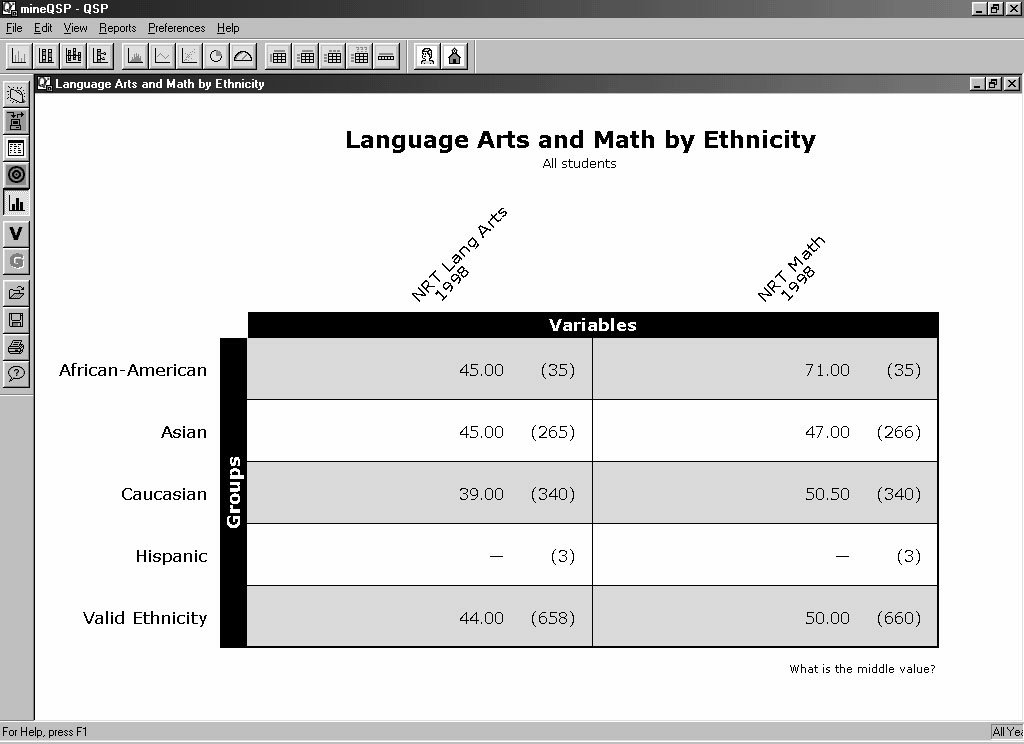
Here is the Table generated by our example. It shows the
median score for each ethnic Group on Language Arts and
Math in 1998.
Note
Notice that there is no Year box in the Table dialog. This is because
the Table report allows you examine Outcome Variables spanning as
many years as you would like.
78
QSP User Guide
!
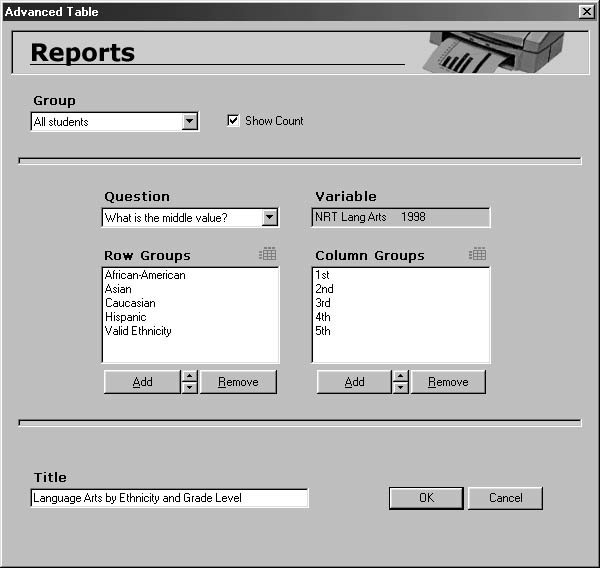
Advanced Table
1. Select the question you want to ask. If you ask
What is the
Average?
or
What is the Middle Score?
you will be prompted
to select an Annual Numerical Variable for a specific year.
(Thus, no Year box in this dialog.) This prompt will not
appear if you ask
How Many.
2. The Variable you selected will appear here. We have
chosen
NRT Lang Arts 1998
.
3. Add the
Row Groups
here (up to 8). Here, we have selected
various ethnic Groups.
4. Select the
Column Groups
here (up to 8). Here, we have
selected various grades.
Reports View
79
1
3
2
4
5
6
5. Check the
Show Count
box if you want the Advanced
Table to show the number of students in each cell (in
parenthesis).
6. Enter
Title
of your Chart.
Click
OK
.
Here is the Advanced Table generated by our example. It
shows the median score for each ethnic Group, within each
grade level, on Language Arts in 1998. For instance, the first
cell shows us that, for the seven African-American 1st
Graders, the median score on
NRT Lang Arts
was 79.
80
QSP User Guide
Questions Table
1. Add the
Row Groups
you are interested in here.
2. Select the Annual Numerical Variable you are interested in.
3. Check the boxes of the questions you want to ask about
the selected Groups’ performance on the Variable. The
questions
How many?
and
How many tested?
are auto-
matically checked. Here, we have checked
What is the
middle score?
4. Enter
Title
of your Chart.
Click
OK
.
Reports View
81
1
4
2
3
Here is the Questions Table generated by our example. It
answers multiple questions about the performance of various
ethnic and gender Groups on NRT Math 1998.
82
QSP User Guide
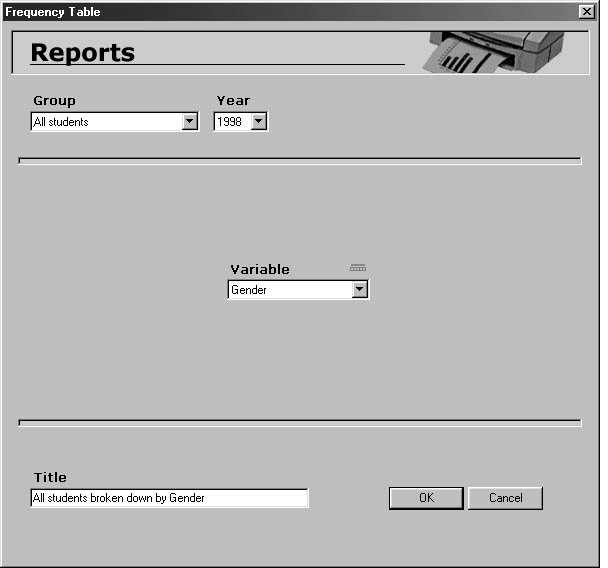
Frequency Table
1. Think of the Frequency Table as a Pie Chart in table format.
Choose the appropriate Variable by clicking on the down
arrow and scrolling to the Categorical Variable of your
choice. Here, selecting
Gender
will give you both the
number and percentage of
Male
and
Female
students.
2. Enter
Title
of your Chart.
Click
OK
.
Reports View
83
1
2
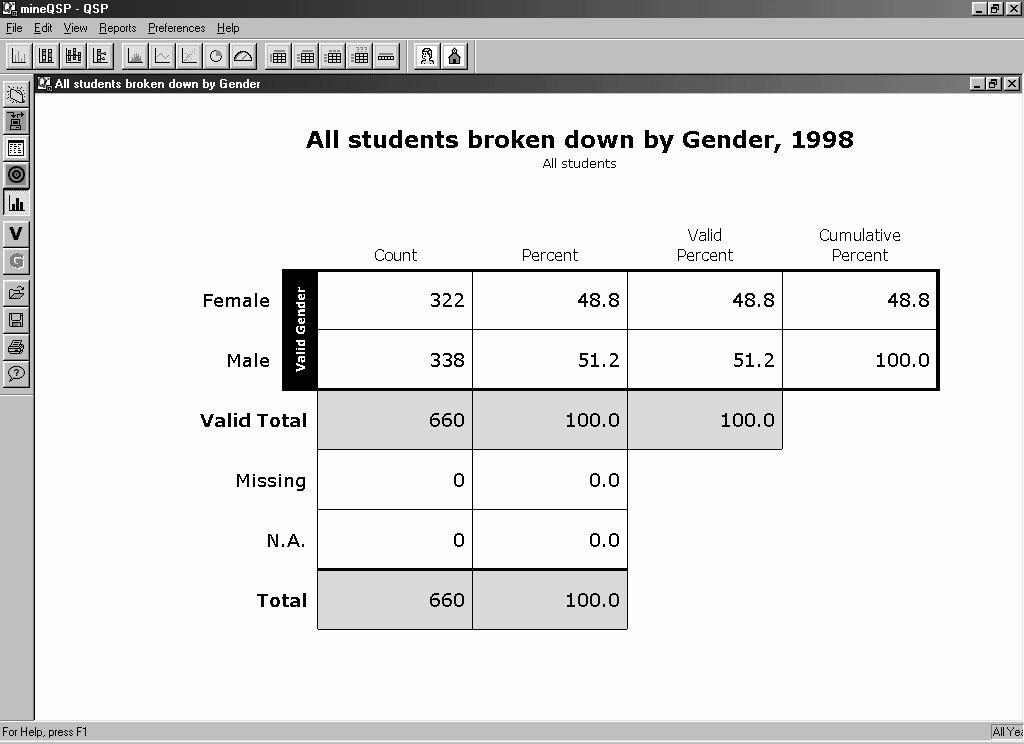
Here is the Frequency Table generated by our example.
84
QSP User Guide
How do I manage
my completed Charts?
When you create a Chart, it is added to the Reports View. You
can see the
Name
of each Chart, the
Year
it concerns, the
Type
,
the
Date Created
, and the
Groups of Interest
within it. If you
right-click on a Chart, you will get a pop-up menu with the
following options:
Show Chart
This option opens the selected Chart in graphical form.
Alternately, you can double-click on a Chart in the Reports
View, and it will open. Remember, if you don’t recompute the
Chart (see
Recompute Chart
below), it may not reflect the cur-
rent state of your database.
Show Text Version
This option opens the selected Chart in textual form. You
have the choice of printing the results (click
Print
) or return-
ing to the Reports View (click
OK
).
Edit Chart
This option opens the selected Chart’s original dialog box as it
was when you created it. You can edit any of the fields and
then click
OK
to save the Chart in its new form.
Recompute Chart
This option opens the selected Chart and redraws it based on
the current data. Use this if you have recently changed the
database, and want the Chart to reflect those changes.
Delete Chart
This option simply deletes the selected Chart. You will be
asked to confirm your choice. Click
OK
to delete, or
Cancel
to leave the Chart as is.
Reports View
85
Duplicate Chart
This option creates a copy of the selected Chart. Use this if
you want to make a Chart similar to one that already exists.
Instead of creating a whole new Chart, just copy the similar
one and use
Edit Chart
to make changes.
Show Narrative
This option allows you to add a textual explanation to a Chart
that you have created. You will see a dialog box where you
can enter as much text as you would like. At any time you
may return here to edit and save changes to the text.
Save as BMP
This option allows you to save a Chart as a graphic image.
When you select it, you will see a dialog asking where to save
the BMP. Choose the appropriate place on your hard drive
and click
Save
. You can then place this image into your own
documents as you would any other graphic.
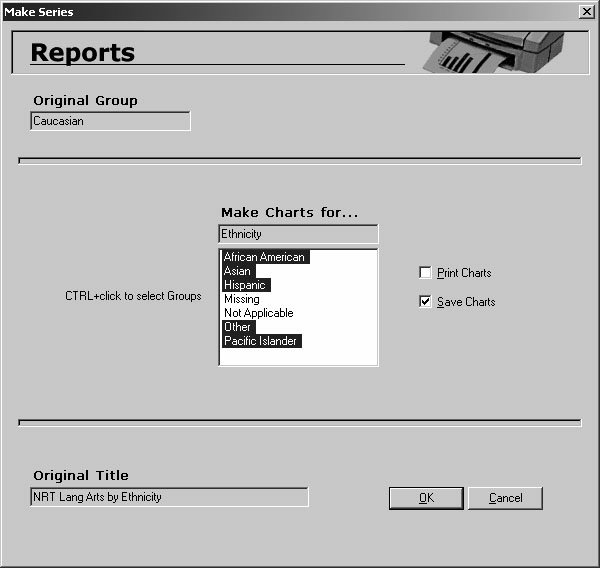
Make Series
This option allows you to create several Charts based on the
selected Chart. In order to make a Series, the original Chart
must use a
System
Group as the main Group (in the upper left
corner of the Chart dialog box). For example, if you create a
Bar Chart with
Caucasian
as the main Group, and you want to
make the same Bar Chart for all other ethnicities, click on
Make Series
. You will be presented with the Make Series
dialog (see next page).
Here, you select which Groups from the associated Variable
(
Ethnicity
) you would like to generate Charts for. You do so
by holding down
CTRL
and clicking on the appropriate
Groups. You can immediately
Print
the Charts or simply
Save
them to the Reports View. Click
OK
to confirm.
86
QSP User Guide
Setting Preferences
The
Preferences
menu offers a few choices to help you
manage your Charts. You may want to set the minimum
sample size for your Charts to eliminate insignificant data.
Go to the
Preferences
menu and select
Minimum Sample
Size
.
You can set it from 5 to 15 students. In other words, if
you set it to 10, then any Group with fewer than 10 students
will not appear in your Charts.
The other option in the
Preferences
menu is
Recompute on
Loading
. When checked, this automatically recomputes each
Chart each time you open it. If you want
every
Chart to reflect
the most current data, then click
Recompute on Loading
so
that it is checked. If you want to keep the data in older Charts
as is, then make sure this is unchecked. (You can still selec-
tively recompute Charts with the
Recompute Chart
popup
option.)
Reports View
87
Using the Make
Series option
How do I
use Folders?
As you create more and more Charts, the Reports View can
get pretty crowded. This is where Folders come in. Folders
help you to organize Charts created in QSP into topics of your
choice. You have several options for customizing your folder
organization:
Creating a Folder
To create a Folder, select
New Folder
from the
Reports
menu
and click
OK
. Give a name to the Folder, for example,
6th
Graders
. In order to view the contents of a Folder, simply
double-click on it. If you want to return to the main Reports
View, double-click on the
Root Folder
icon.
Creating Charts within a Folder
When you create a Chart, QSP will place that Chart inside the
current Folder. For example, if you have the
6th Graders
Folder open and you create a Bar Chart, QSP will store it in
that Folder.
Moving Charts between Folders
To move a Chart from one Folder to another, right-click on the
Chart and select
Move to Folder
. Click on the down arrow
and select the Folder of your choice and click
OK
. Your Chart
can now be found in the Folder you selected.
Renaming a Folder
If you wish to rename a Folder you’ve already created, right-
click on the Folder and select
Rename Folder
. Give the
Folder a new name and click
OK
.
Deleting a Folder
In order to delete a Folder, right-click on the Folder and select
Delete Folder
. You will get a dialog box confirming that you
want to delete the Folder. Please note that deleting the Folder
88
QSP User Guide
also deletes all the Charts stored within the Folder. Click
OK
to confirm the deletion of the Folder and all its contents.
How do I create an
Individual Student Report?
The Individual Student Report (ISR) allows you to create a
performance Report Sheet for each individual student within
a specific Group. To start, click on the
ISR
button (Appx II).
1. Enter a
Title
, or you may choose to keep the default title.
2. Select the question you want to ask, either
What is the
Middle Value?
or
What is the Average?
3. This is a sample of what an ISR looks like. The top section
contains background information such as
Name
,
Birthdate
,
etc. QSP will enter all these values for you.
Section 1
is
customizable, allowing for multiple Variables (ideally from
the same subject area), plus a Bar Chart.
Section 2
is
customizable as well, allowing for multiple Variables
(ideally from the same subject area), plus a Slicebar.
Click
Next
to continue.
Reports View
89
1
2
3
Section 1
1. Enter a
Name
for Section 1, this should reflect the Variables
you choose for this section. Here,
Math
is entered.
2. Select the
Main Variable
for Section 1. This should be a
performance-level (Categorical) test from a general subject
area (in this example,
Math
). Here,
ISAT Math-PL
is chosen.
3. Add any
Sub-Variables
for Section 1 here. These should be
(Numerical) subscales of the Main Variable, or at least other
tests in the same general subject area (
Math
).
Click
Next
to continue.
90
QSP User Guide
1
2
3
1. Choose a
Variable
for your Bar Chart here. Again, this
should be from the same general subject area (
Math
). Here
ISAT Math
is selected.
2. Add any
Comparison Groups
here. Their median scores
will be represented as bars in the Chart. Use these to
compare to the individual student’s score.
Click
Next
to continue.
Reports View
91
1
2
Section 2
1. Enter a
Name
for Section 2, this should reflect the Variables
you choose for this section. Here,
Reading
is entered.
2. Select the
Main Variable
for Section 2. This should be a
performance-level (Categorical) test from a general subject
area (in this example,
Reading
). Here, we have chosen
ISAT Read-PL
.
3. Add any
Sub-Variables
for Section 1 here. These should be
(Numerical) subscales of the Main Variable, or at least other
tests in the same general subject area (
Reading
).
Click
Next
to continue.
92
QSP User Guide
1
2
3
1. Choose a
Variable
for your Slicebar here. Again, this
should be from the same general subject area (
Reading
).
Here
ISAT Reading
is selected. After you select the Slicebar
Variable, the
Options
dialog box will automatically appear.
Select the Categories and ranges as you would in a regular
Slicebar (see pg 61).
2. Add any
Comparison Groups
here. Their median scores
will be represented as icons in the Chart. Use these to
compare to the individual student’s score.
Click
Next
to continue.
Reports View
93
1
2
The final dialog box of the ISR gives you a summary of the
information you selected for the Report:
1. Examine the information here to make sure it is complete
and correct. If you want to change anything, click the
Back
button, edit where appropriate, and click the
Next
button
until you return to this dialog. To edit the
School
box, you
must go to your
User Profile
and edit it there (see pg 11).
2. Select the
Group
you would like to print ISRs for. If you
would like to print an ISR for one student only, create a
Custom Group (see pg 30) that contains only that student.
Click
Finish
.
94
QSP User Guide
1
2
The Print dialog box (see below) tells you how many
Individual Student Report Sheets will be printed. Click
Print
to print them all out immediately. Click
Save
to save the ISR
in its current state. Later, when you want to print the Sheets,
right-click on the name of the ISR within the Reports View.
Select
Edit Report
. You will see the first dialog of the ISR.
Click
Next
(making sure each dialog has the correct informa-
tion) until you get to the
Summary
dialog. Click
Finish
,
then
Print
.
How do I create a
School Performance Report?
The School Performance Report (SPR) generates a series of
informative Charts to answer one of eight common school-
related questions. Before starting, we recommend you create
a Folder (see pg 88), give it an appropriate name, and open it.
By doing so, you will make the SPR place all the Charts it
generates into this Folder, and thus keep everything orga-
nized nicely. Next, click on the
SPR
button (see Appx II).
Reports View
95
You will get the following dialog:
1. Enter the
Title
of your Report. This is only for reference,
but should reflect the name of the Folder you created for
this particular SPR.
2. Select the
Year
for the Report.
3. Select one of the
School Performance Questions
.
4. Checking the
Edit Charts
box will allow you to customize
any of the Charts before the SPR generates them.
Click
OK
.
96
QSP User Guide
1
2
3
4
You will then see the following dialog:
Here, the SPR displays the
Default Variables
, or what Variables
it’s looking for. Under
Variables to Use
, select which Variables
should be used for this Report. Accordingly, you can change
the question itself (at the top of the dialog) to reflect the
Variable changes. Click
OK
to continue.
If you chose the
Edit Charts
option, you will next see the
dialog box for the first Chart the SPR is planning to generate.
Edit where appropriate and click
OK
. Repeat this process
until you have seen all the dialog boxes. The SPR will then
generate the Charts and place them in the current Folder.
Reports View
97
98
QSP User Guide
Exporting
Data
Background
QSP gives you the ability to export the information in the
database for use with other statistical software to do more
complex analyses. QSP can export in a format that virtually
all statistical software or database programs can import.
You can also export data from one QSP project to another.
How do I export
my QSP Database?
The exporting process is essentially the opposite of the
import. Either select
Export
from the
File
menu, or click on
the
Import/Export
button (see Appx II) and the Export Wizard
opens. The first dialog (see pg 98) has two large boxes:
QSP
Variables
on the left, and
Text File
on the right. In the Variables
box, click on a Variable you might wish to export. Note that
the contents of the Variable are shown in the
Variable Items
box. If this is a Variable you would like to export, click on
Select
to move it to the
Text File
box. If you want to export all
of the Variables in your database, then simply click the
Select
All
button. When you have selected all the Variables you
want to export, click on the
Ignore Rest
button. Select the
year of the data you wish to export with the
Year
pulldown.
You also have some options for your export:
Exporting Data
99
You can export data for all students, or for a specific Group.
Click on the
Group
pulldown and select
Set Group
. This will
take you to the
Groups
dialog, where you can select the Group
of interest. Also, you may want to export the header row
(QSP Variable names) along with the data. If so, then click on
the
Export Header Row
check box. Lastly, you may want to
export a Codebook for your data that explains what is in each
column. If so, then click on the
Export Codebook
checkbox
.
Click
Next
to continue.
If you have selected any Categorical Variables, you will next
see a dialog box (see pg 99) that asks how you would like to
name the various Categories. You can use the
QSP Name
(what you called it in QSP), the
QSP Value
(what QSP stored it
as), or the
File Value
(what the original imported database
stored it as). If your data is going back to the district, and that
is where you imported your data from, we recommend you
use the File Value so that it will match their system without
having to be changed.
100
QSP User Guide
Export Dialog
Next, choose the
Item Separator
which separates each column
(comma is the default) and the
Student Separator
which sepa-
rates each student’s record (return is the default). Click on
Next
to continue.
Finally, give the export file a
File Name
and select the directory
where you want to save the exported file. Then click on
Save
.
Exporting Data
101
Category Values
Separators
102
QSP User Guide
Appendix I:
Optimizing
Your Data
Background
QSP accepts data in two formats:
Text
(*.txt) and
Comma
Separated Values
(*.csv). However, the .csv format provides
a much more seamless Import into QSP. This section shows
you how to convert your data into this format.
How do I convert
my original database?
Open your file in Microsoft Excel. When you get to the Open
dialog in Excel, click on the down arrow next to
Files of Type:
and select
All Files (*.*).
Locate the filename for your data.
It will typically be in one of two formats:
Excel
(*.xls or *.xlb)
or
Text
(*.txt).
Appendix I
103
Select the file type (see below) by clicking on the button for
Delimited
or
Fixed width
. Your file will probably be in
delimited format. Here, in the
Preview of File
box, you can see
that this example is delimited. The file is comma separated,
with single quotes around each field entry. Once you have
selected the file type, click
Next
to continue.
Now you will need to check the delimiters that are being used
(see below). You will notice that when you select the
Comma
checkbox, the
Data preview
box shows the columns separated
correctly. Note for this case that the
Text Qualifier
chosen was a
single quote (‘). You may or may not have this in your file.
104
QSP User Guide
Selecting the
file type
Checking the
delimiters
Click on
Finish
. Do not click
Next
because that step is for con-
verting date formats, and QSP will not recognize date formats
that are converted in Excel.
Header Rows
The example file here has a
header row
as part of it. A header
row contains the column headings, such as
Student Number,
Last Name,
etc. If your file does not have a header row, you
can create one (we suggest you do this so that there is less
chance of error). To add a header row in Excel, highlight the
first row holding the first student's information by clicking on
the number for that row (in this case,
1
). Select
Row
from the
Insert
menu. Use a codebook to give the correct name for
each field. Try to use short names and do not use punctuation
marks, especially commas. Spaces are okay as are underscore
marks (ex.
Student_ID
).
You are now ready to save the file as a Comma Separated
Values (.csv) file. Select
Save As
from the
File
menu. In the
Save As
dialog box (see below), click on the arrow next to
Save
as type
and select
CSV (Comma delimited) (*.csv)
. Give
your file an appropriate name, and click
Save
to finish.
Appendix I
105
Saving the file
Error on import
During the importing process you might get something like
the following error:
If this occurs, open your .csv file in Excel and select all the
data so that it is highlighted. Select
Copy
from the
Edit
menu.
Open a new workbook, select
Paste
from the
Edit
menu, and
save the file as another .csv file. When you import again, the
error should be gone.
106
QSP User Guide
Appendix II:
Technical
Information
Background
It is important for the users to understand exactly what the
Quality School Portfolio Data Manager does and does not do.
Essentially, the Data Manager acts as a tool for grouping,
viewing and reporting the data within a file. The program
manages the data presented to it according to priorities
determined by the user, for the purpose of empowering the
user with the needed information with which to inform the
school’s reform processes.
Technically, the QSP Data Manager sits “on top of” a database
file and restricts access to that file to the QSP program user
only. Once the user activates the import process, the database
file becomes the storage place for the data being imported.
The Data Manager then clones that file each session, using
the clone for all of the program’s data manipulations. On
user command, QSP saves all additions and changes back to
the database file.
Different schools and districts store categorical data different-
ly. Some utilize the variable Gender, while others call that
same variable Sex. We have observed districts which store the
gender data in all these configurations:
0/1, Male/Female,
and
Appendix II
107
M/F
. QSP is a reporting tool concerned mostly with providing
the school personnel with meaningful ways to utilize the data
stored. The Data Manager provides unparalleled flexibility in
this regard by allowing the user to determine how data is
viewed regardless of the format in which it is stored. While
the user may specify male students as
0, Male
or
M
in QSP, the
database will always retain the original format for the data.
In addition, QSP creates a number of files for each database
you create. Each of these files is important for the functionality
of the program and will appear in the database folder.
Their formats and corresponding extensions are shown
below, where the asterisk refers to the name the user gives
the data file.
*.ddf
The database instruction set for this file.
*.flt
The list of Groups available to this dataset.
*.gol
The list of Goals available to the dataset.
*.rpt
The list of Reports saved for the dataset.
There is a limit to the number of variables allowed in QSP.
Present in the program are spaces for 39 pre-built variables of
several types and 108 optional variables. There is no limit,
however, to the number of records. It is
strongly
recommended,
however, that the user create a separate QSP database for each
different cohort being reviewed. In a single database, QSP can
support data for a subset of students over an extended period
of time with ease. However, the smaller the initial group of
students, the faster QSP will analyze the data.
108
QSP User Guide
Appendix II
109
The Toolbar
Project
Create Projects
Database
See the Database view
Reports
See the Reports view
Groups
Edit your Groups
Save
Store any new changes
Help
See the user guide on-screen
Import/Export
Transfer your data
Goals
See the Goals view
Variables
Edit your Variables
Open
Open a new Project
Print
Output the Database view
110
QSP User Guide
The Report Toolbar
Bar Chart Histogram Gauge Bar Chart
Floating
Bar Chart
Scatter
Plot
Individual
Student
Report
Table
Slicebar Pie Chart Advanced
Table
School
Performance
Report
Percentile
Bar Chart
Line
Graph
Frequency
Table
Crosstab
Appendix II
111
Contacting us at CRESST
Derek Mitchell 310.794.4393
dmitchell
@
cse.ucla.edu
John Lee 310.794.9155
johnjn
@
ucla.edu
Back to top