| |
A |
B |
C |
D |
E |
F |
G |
H |
I |
J |
K |
L |
| 1 |
|
|
|
| 2 |
|
|
| 3 |
|
|
| 4 |
|
|
| 5 |
|
|
| 6 |
|
|
| 7 |
|
|
| 8 |
|
|
| 9 |
|
|
| 10 |
|
|
| 11 |
|
|
| 12 |
|
|
| 13 |
|
|
| 14 |
|
|
| 15 |
|
|
| 16 |
|
|
| 17 |
|
|
| 18 |
|
|
| 19 |
|
|
| 20 |
|
|
| 21 |
|
|
| 22 |
|
|
| 23 |
|
|
| 24 |
|
|
| 25 |
|
|
| 26 |
|
|
| 27 |
|
|
| 28 |
|
|
| 29 |
|
|
| 30 |
|
|
| 31 |
|
|
| 32 |
|
|
|
|
|
|
|
|
|
|
|
|
|
Back to top
| |
A |
B |
C |
D |
| 1 |
|
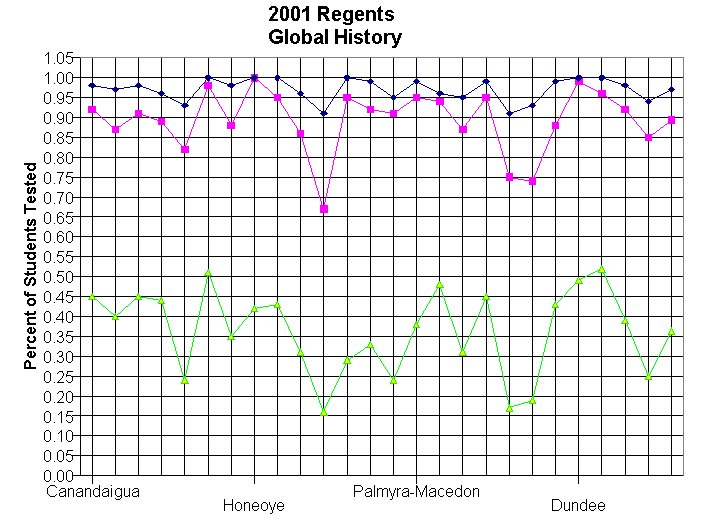
%tested55-100 |
%tested65-100 |
%tested85-100 |
|
| 2 |
Canandaigua |
0.98 |
0.92 |
0.45 |
|
| 3 |
Bloomfield |
0.97 |
0.87 |
0.40 |
|
| 4 |
Geneva |
0.98 |
0.91 |
0.45 |
|
| 5 |
Gorham-Middlesex |
0.96 |
0.89 |
0.44 |
|
| 6 |
Manchester-Shortsville |
0.93 |
0.82 |
0.24 |
|
| 7 |
Naples |
1.00 |
0.98 |
0.51 |
|
| 8 |
Phelps-Clifton Springs |
0.98 |
0.88 |
0.35 |
|
| 9 |
Honeoye |
1.00 |
1.00 |
0.42 |
|
| 10 |
Victor |
1.00 |
0.95 |
0.43 |
|
| 11 |
Newark |
0.96 |
0.86 |
0.31 |
|
| 12 |
Clyde-Savannah |
0.91 |
0.67 |
0.16 |
|
| 13 |
Lyons |
1.00 |
0.95 |
0.29 |
|
| 14 |
Marion |
0.99 |
0.92 |
0.33 |
|
| 15 |
Wayne |
0.95 |
0.91 |
0.24 |
|
| 16 |
Palmyra-Macedon |
0.99 |
0.95 |
0.38 |
|
| 17 |
Gananda |
0.96 |
0.94 |
0.48 |
|
| 18 |
Sodus |
0.95 |
0.87 |
0.31 |
|
| 19 |
Williamson |
0.99 |
0.95 |
0.45 |
|
| 20 |
North Rose-Wolcott |
0.91 |
0.75 |
0.17 |
|
|
|
|
|
|
| 21 |
Red Creek |
0.93 |
0.74 |
0.19 |
|
| 22 |
Penn Yan |
0.99 |
0.88 |
0.43 |
|
| 23 |
Dundee |
1.00 |
0.99 |
0.49 |
|
| 24 |
Romulus |
1.00 |
0.96 |
0.52 |
|
| 25 |
Seneca Falls |
0.98 |
0.92 |
0.39 |
|
| 26 |
Waterloo |
0.94 |
0.85 |
0.25 |
|
| 27 |
WFL BOCES |
0.97 |
0.89 |
0.36 |
|
Back to top